
Project Cost Breakdown
Overview
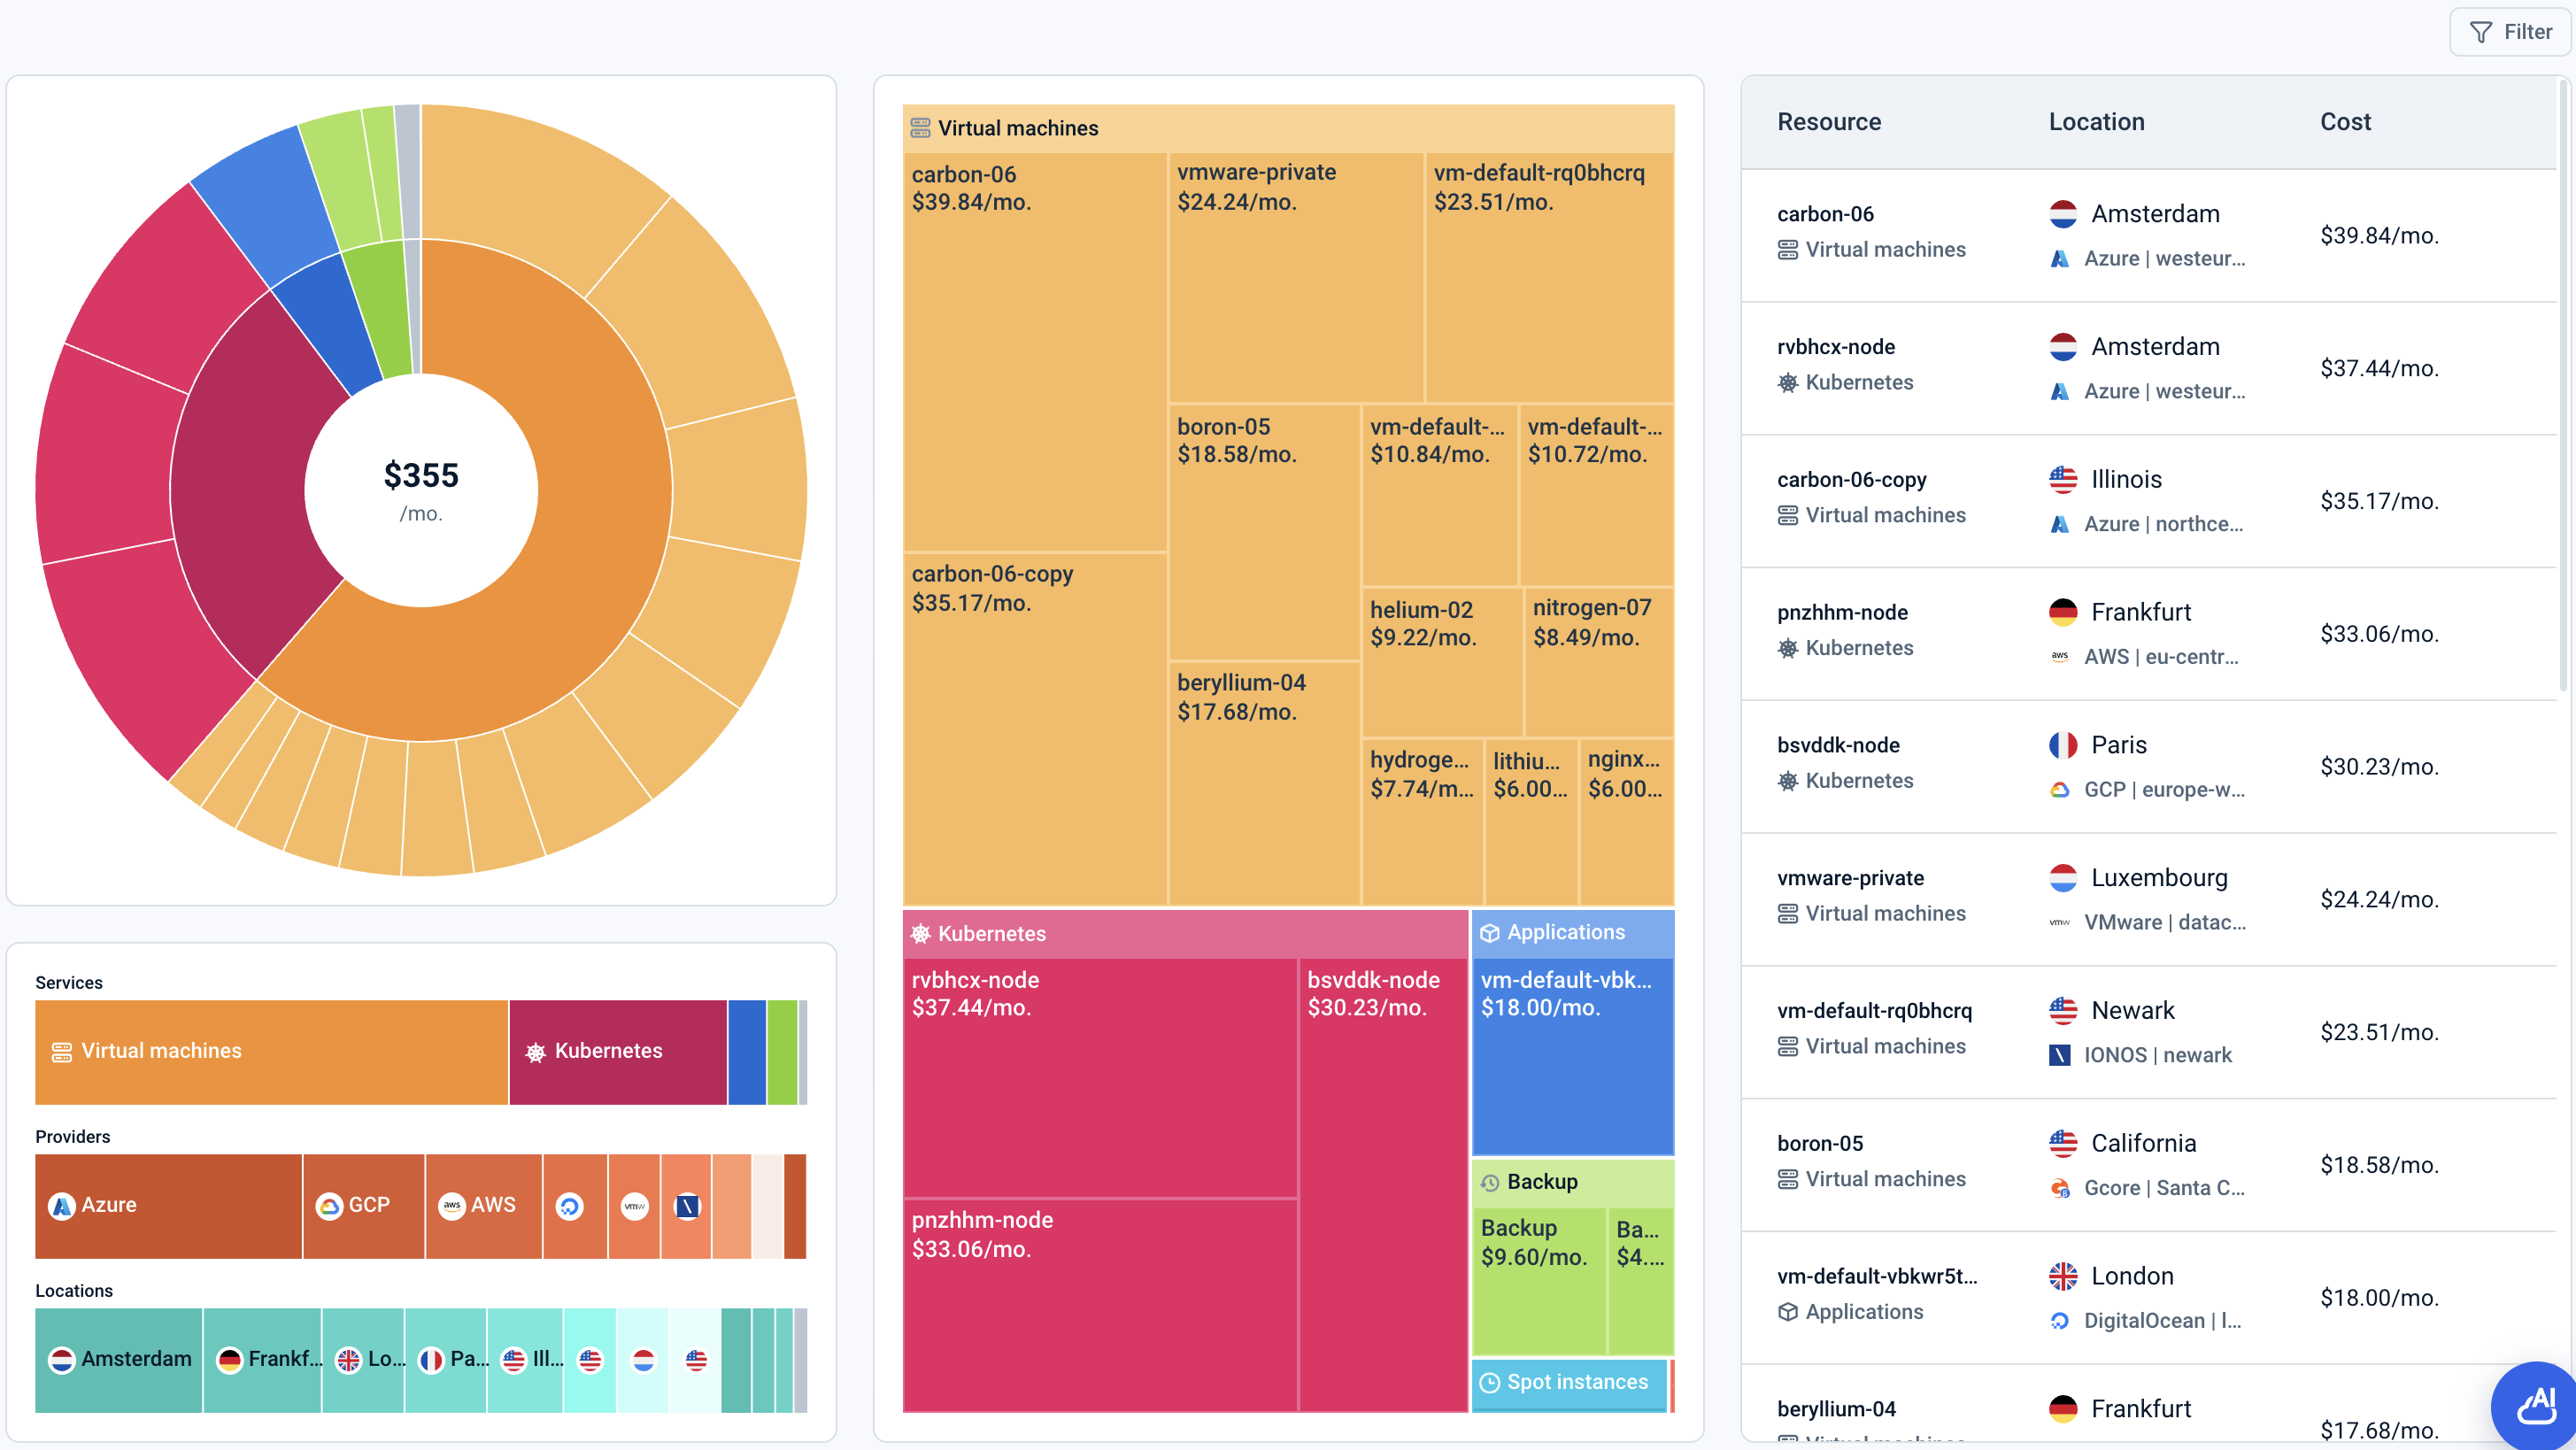
This page provides users with a detailed breakdown of cloud infrastructure costs, helping them understand how expenses are distributed across services, and resources.
The dashboard offers a consolidated view of all billable resources focusing on recurring infrastructure costs. It excludes one-time charges such as API calls, ensuring a clear representation of ongoing expenses.
At the top, a hierarchical chart visualizes how total costs are distributed across services, and resource components, allowing users to explore the cost structure. Additional charts display cost distribution by categories such as services, providers, and locations, as well as a treemap of atomic infrastructure elements to highlight the most expensive components.
On the right side, a detailed table lists individual resource components along with their associated service, provider, location, and cost.
Analytics on this page
How can I filter resources? - FAQ
In your project, various resources may be created across different services, cloud providers, locations, time periods, etc. This filter allows you to refine and analyze these resources by applying multiple conditions and parameters, providing deeper insights into the data displayed on the dashboard.
Page navigation — Navigation → Open a project → Click on 'Analytics Hub' → Go to 'Cost breakdown' and then click on the Filter button
Choose and apply filters:
- First, select the parameter by which you want to filter data.
- When selecting Tag as Parameter, you will be presented with fields to specify the operator, key, and an optional value.
- Leave the value field empty to find all products with the specified key, regardless of its value.
- Select No tag value for the value field to find only products that have the specified key and an associated value that is empty.
- In the field that appears on the right, select the appropriate operator from the dropdown list.
- Enter the value by which you want to filter, or select from the proposed options.
- Click the Apply button to apply the selected filters.
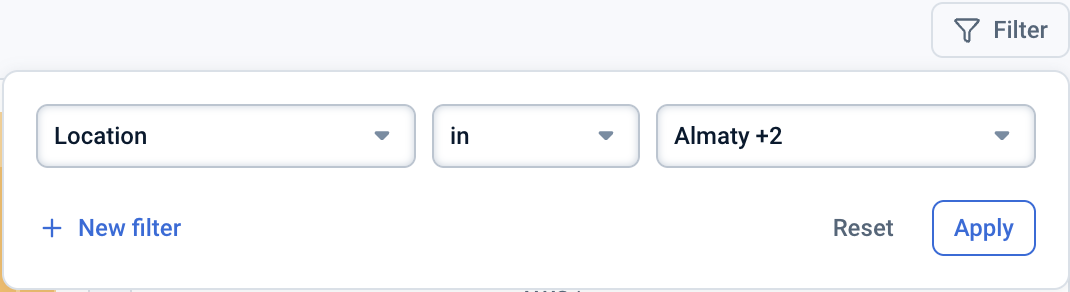
Applied filters appear as chips above the charts.

To filter by multiple parameters, use one of two ways:
- In the Filter control, click + New filter while selecting filters.
- Click the + button to the right of the applied filters bar.
To reset a filter, use one of three ways:
- Reset a single filter: In the Filter control, click the Trash icon next to the filter, then click Apply.
- Click the ✕ button on the corresponding chip.
- Reset all filters: In the Filter control, click Reset, then click Apply.
Last updated on 12 Aug 2026