
Project Summary
Overview
This page provides a graphical and analytical view of the cost of services and overall project expenses, as of date.
Users can also launch pages to add and manage virtual machines, backup policies, spot instances, volumes, Kubernetes (K8s) clusters and applications, for a specific project that can be selected in the pop-up modal.
There following tabs are the summary tabs that provide a summary of the project from different perspectives.
Analytics report on the page
Where can I view the current or historical cost breakdown of my project? - FAQ
Returning user
Page navigation — After login, click on “All projects”. Select your project.
You will be able to see a dashboard with two main components in the top half of the “Summary” tab page
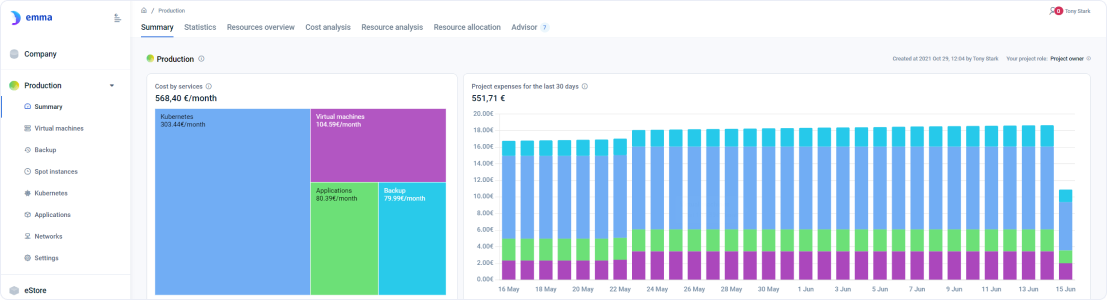
The first chart shows a breakdown of the cost based on the services utilized in the project. This chart provides a visual way of breaking down your costs in the form of a treemap chart. A treemap chart provides a hierarchical view of your data and makes it easy to spot patterns, such as which services are costing you the most per month. You can hover your mouse on the coloured boxes to Services available in the project are detailed in the section named → Actions that can be performed on the page
The second chart shows a breakdown of the cost for every day for the last 30 days. Each horizontal bar in the bar graph represents the total cost of that particular day. Each of the horizontal bars is the sum of all the services that bore cost on that particular day. Each of the services in the horizontal bar represents the cost contributions of each service.
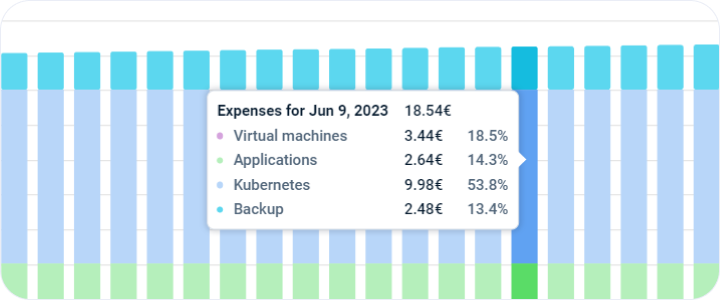
You can hover over the individual bars to look at the breakdown of the cost-bearing services for that particular day. You can also find out the cost contribution, of a particular service, to the day’s cost in percentage.
New user view
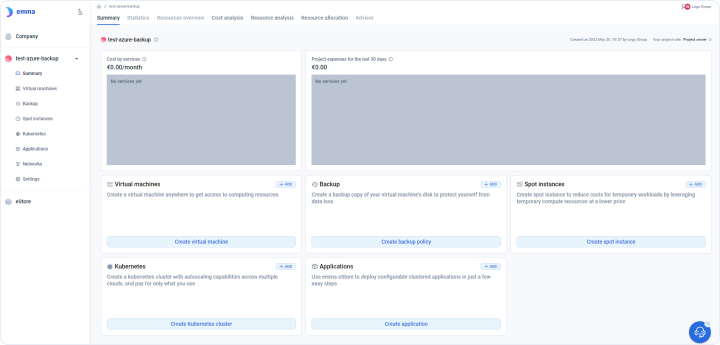
If you're a new user and don't have any active services yet, you will see the below screen.
To create your first project, click on the buttons available below and follow the step-by-step instructions. Once your project is up and running with active services, you can monitor important metrics like the total cost of your projects, their CPU usage, memory usage, and storage usage from your project dashboard.
Actions that can be performed on the page
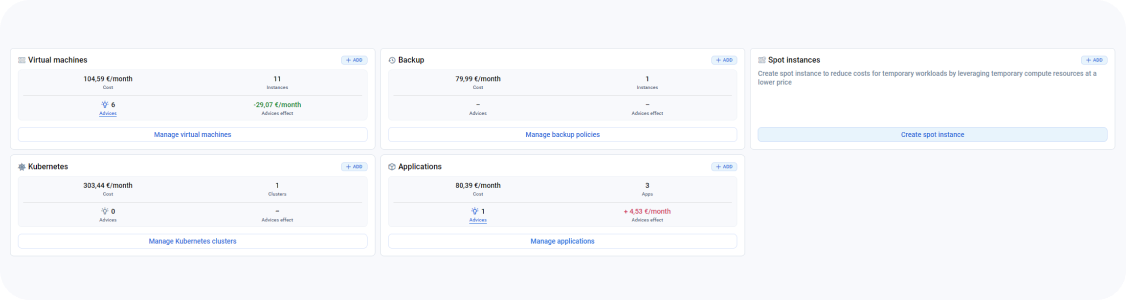
To get started, click on the button for the action you want to perform. Before you can take action like deploying a VM, you'll need to select an existing project or create a new project, in which the VM will be deployed.
Here are the actions you can perform on your projects:
- DEPLOY/MANAGE A VM: Easily deploy a virtual machine and get it up and running quickly. For more detailed help on this topic, refer:Create VMs
- ADD A BACKUP POLICY: Keep your data safe and secure by adding a “backup policy” to your project. For more detailed help on this topic, refer to:Create a Backup Policy
- DEPLOY/MANAGE A SPOT INSTANCE: Take advantage of unused VM capacity in different cloud providers by deploying a spot instance. For more detailed help on this topic, refer: Create Spot Instance
- CREATE A VOLUME: Organize and store your data effectively by creating a volume. For more detailed help on this topic, refer: All volumes
- DEPLOY/MANAGE A K8S CLUSTER: Manage your containers with ease by deploying a Kubernetes (K8s) cluster. For more detailed help on this topic, refer to: Create Kubernetes (K8s) cluster
- DEPLOY/MANAGE AN APPLICATION: Deploy your application and get it up and running on the emma multi-cloud platform. For more detailed help on this topic, refer to: Create an application
With these options, you can customize your experience and take control of your projects.
Last updated on 1 Aug 2026