
Cluster Monitoring
Overview
This page is a useful resource for understanding how your Kubernetes cluster is doing and keeping track of important cluster statistics over time. It allows users to create a personalized dashboard where they can choose which cluster aspects they want to explore, set the level of detail, use filters for different criteria, and select the most important data to see how their cluster is performing.
A Kubernetes cluster consists of various objects, such as namespaces, nodes, pods, deployments, containers, and more. With emma, you have a powerful tool to explore each of these entities, each with its unique set of metrics. The list of available metrics is continually expanding, providing users with new insights and capabilities.
By refining your cluster insights, this page allows you to make informed decisions and optimize your cluster's performance.
Information on the page
Tools:
- Choose configuration. This is a dropdown menu that allows users to select or manage dashboard configurations. It provides flexibility in customizing the layout and content of their dashboard.
- Choose object to display. This dropdown menu empowers users to select a specific cluster object for exploration. They can choose to focus on the entire cluster itself or drill down into individual components like nodes, namespaces, and more.
- Choose breakdown. In this dropdown menu, users can select the level of detail they wish to see. For example, if they want to explore the cluster's composition by nodes, they can choose "by nodes" as their breakdown option.
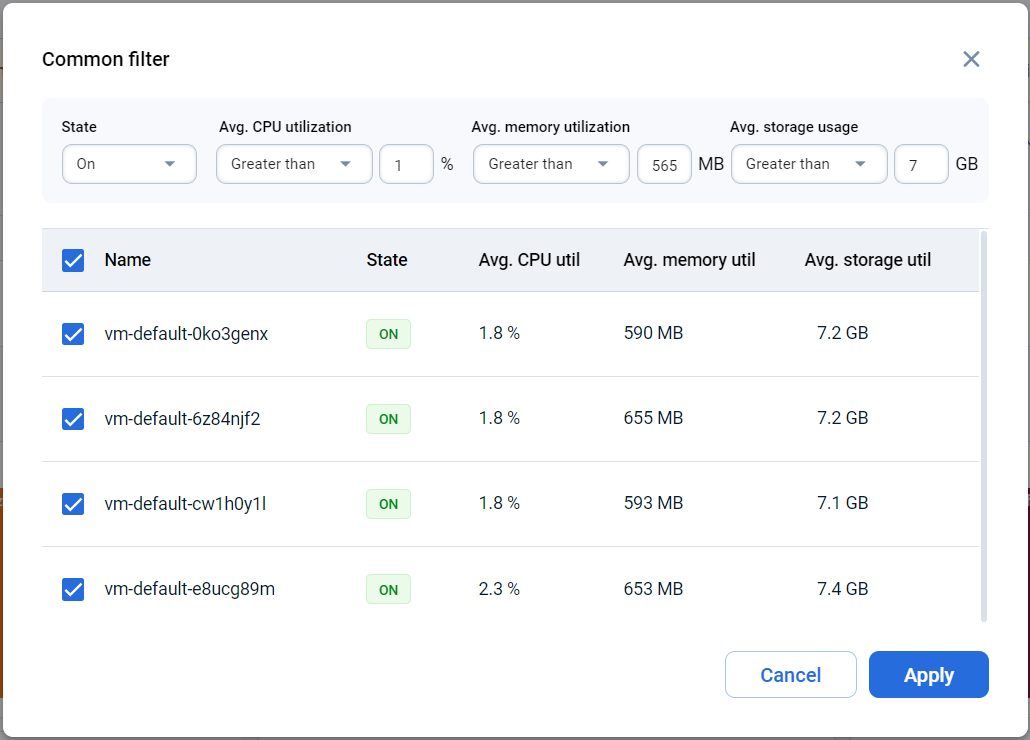
- Filters. A window that enables users to refine dashboard content by applying conditions to display entities based on their specific criteria:
- State
- Avg. CPU utilization
- Avg. Memory utilization
- Avg. Storage utilization
Users can also select specific objects to display, streamlining their focus on critical entities within the Kubernetes cluster.
- Choose metrics. This dropdown menu allows users to select the list of metrics they want to explore. It enables them to tailor their dashboard with the most relevant performance indicators for their specific needs.
Data Sections:
“The Current State” section of metrics:
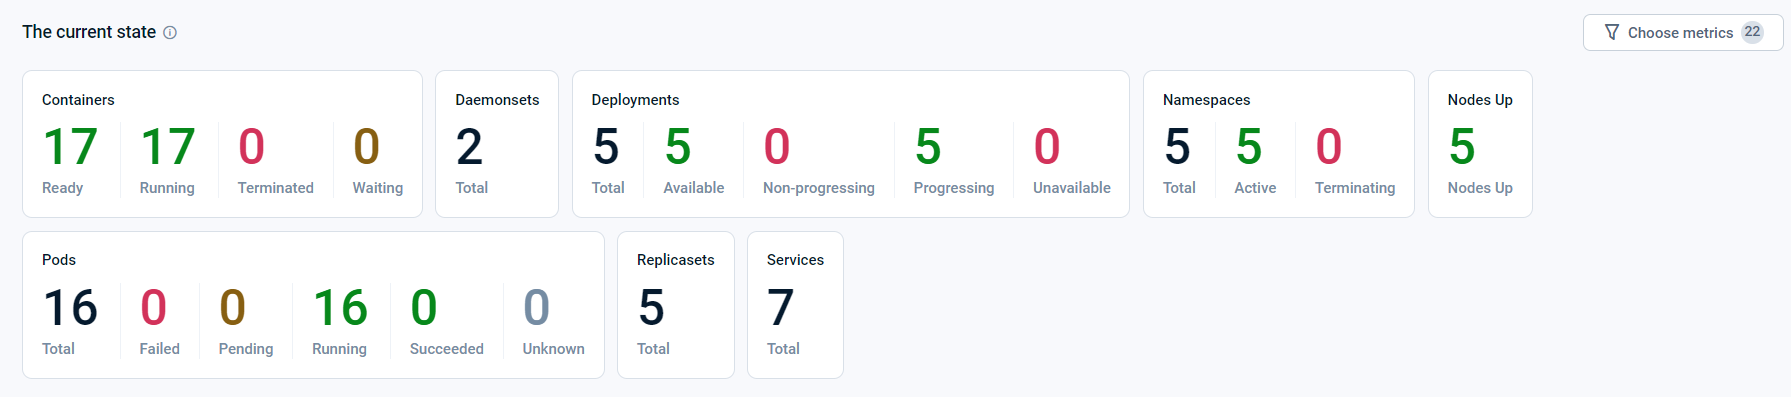
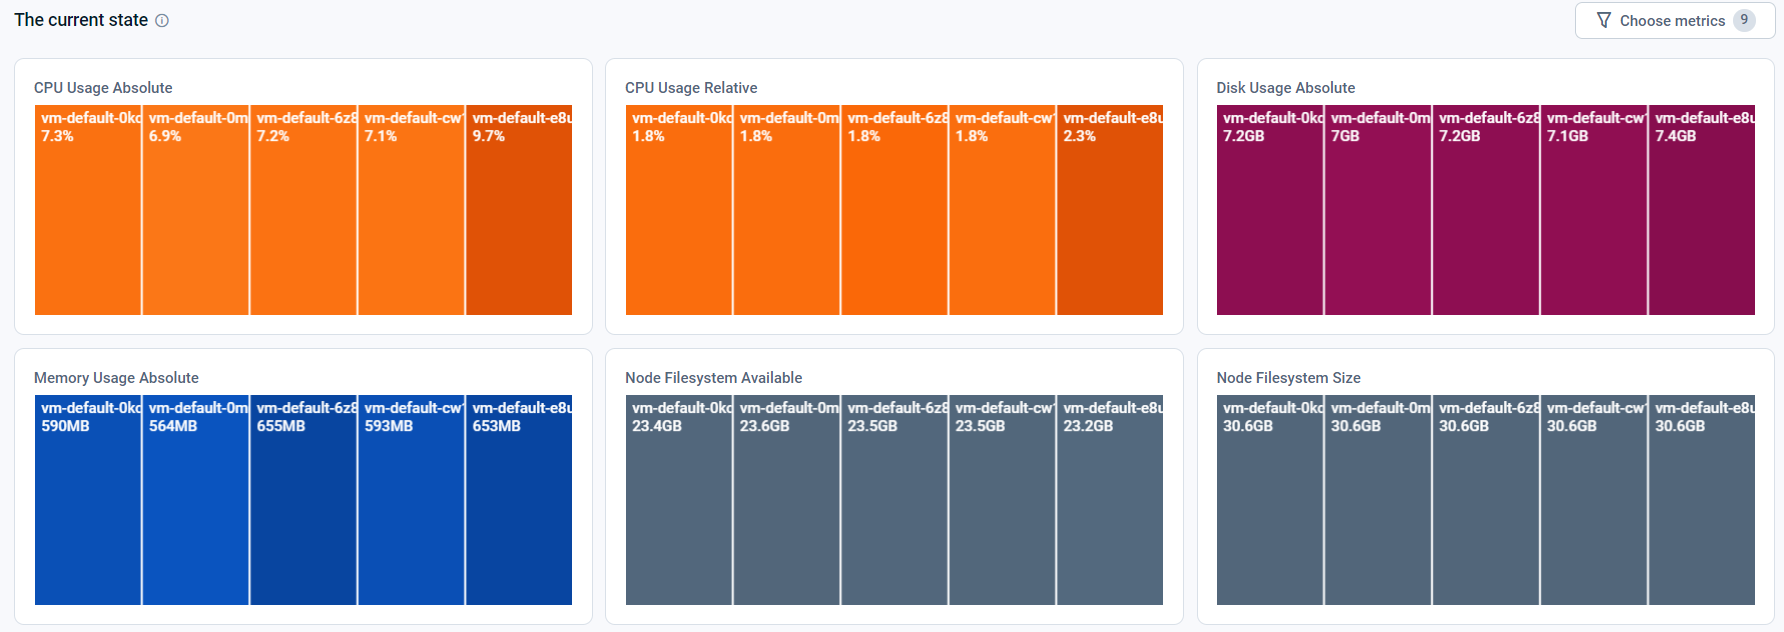
This section provides real-time data on the current state of cluster metrics. It assists users in answering questions like "What is the current CPU utilization of a node?" or "How many running pods does the cluster have?" Depending on the chosen dashboard configuration, data can be displayed either as individual tiles or as treemap charts.
The “GPU Metrics”:
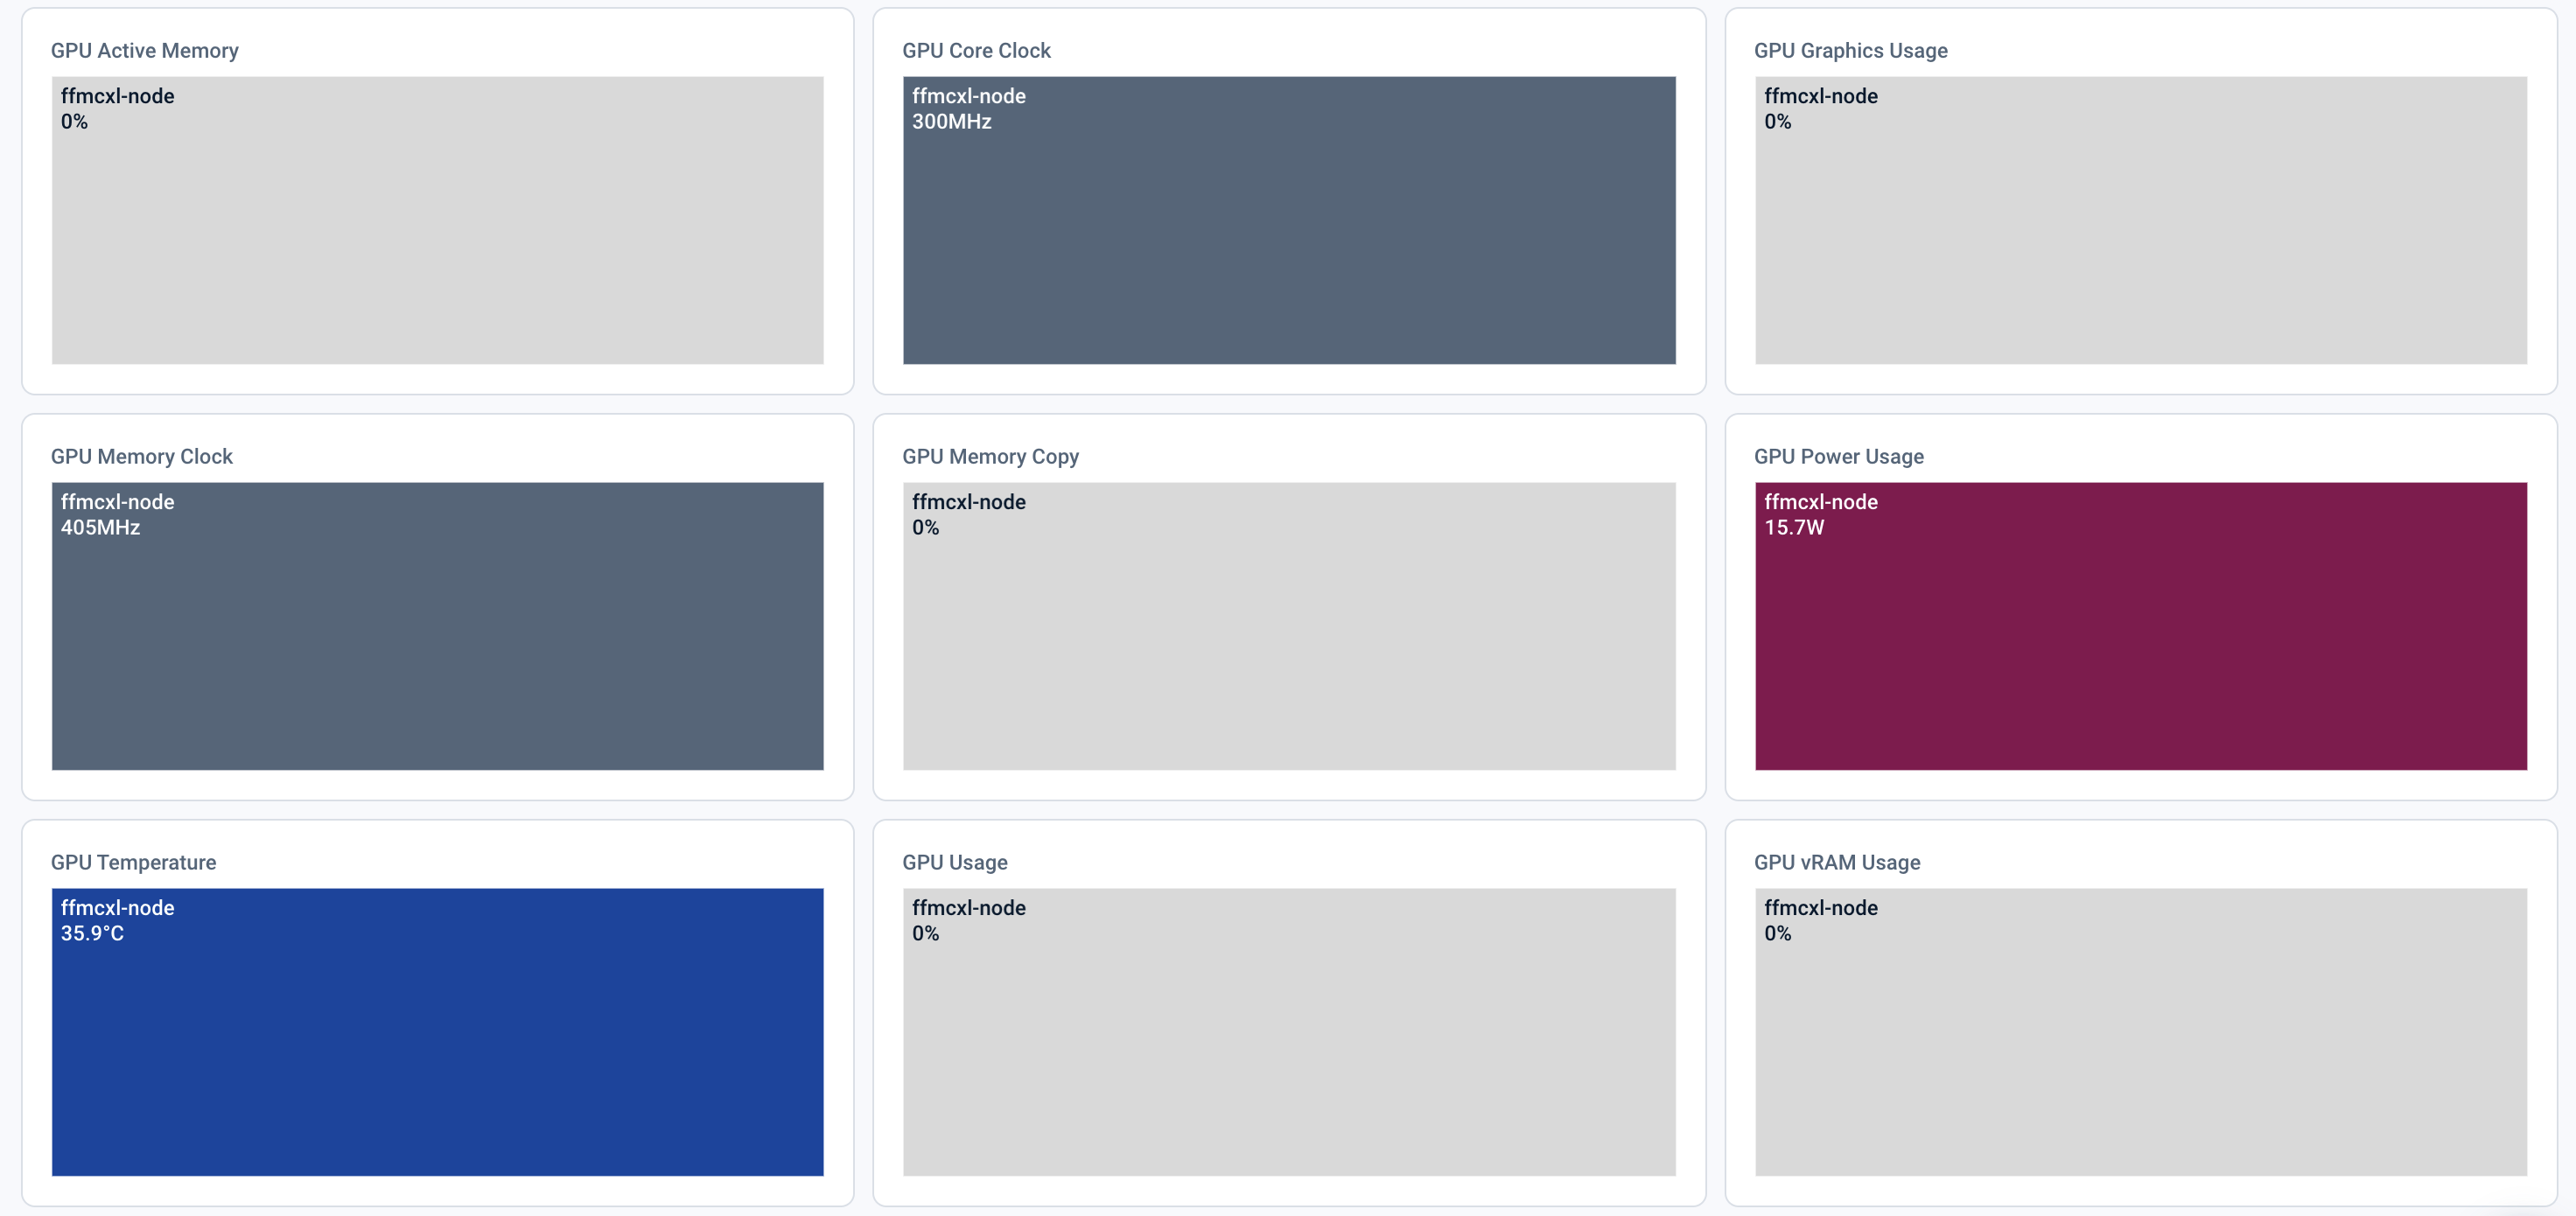
When GPU-related metrics are selected via Choose Metrics, the "Current State" section displays one tile per GPU metric per node. Each tile shows the node name and the current reading. Available GPU metrics include: Active Memory, Core Clock, Graphics Usage, Memory Clock, Memory Copy, Power Usage, Temperature, Usage, and vRAM Usage. Tile background color reflects the metric type and its current significance level. GPU tiles are only populated for nodes with an attached GPU.
The “Changing Metrics” section of metrics:
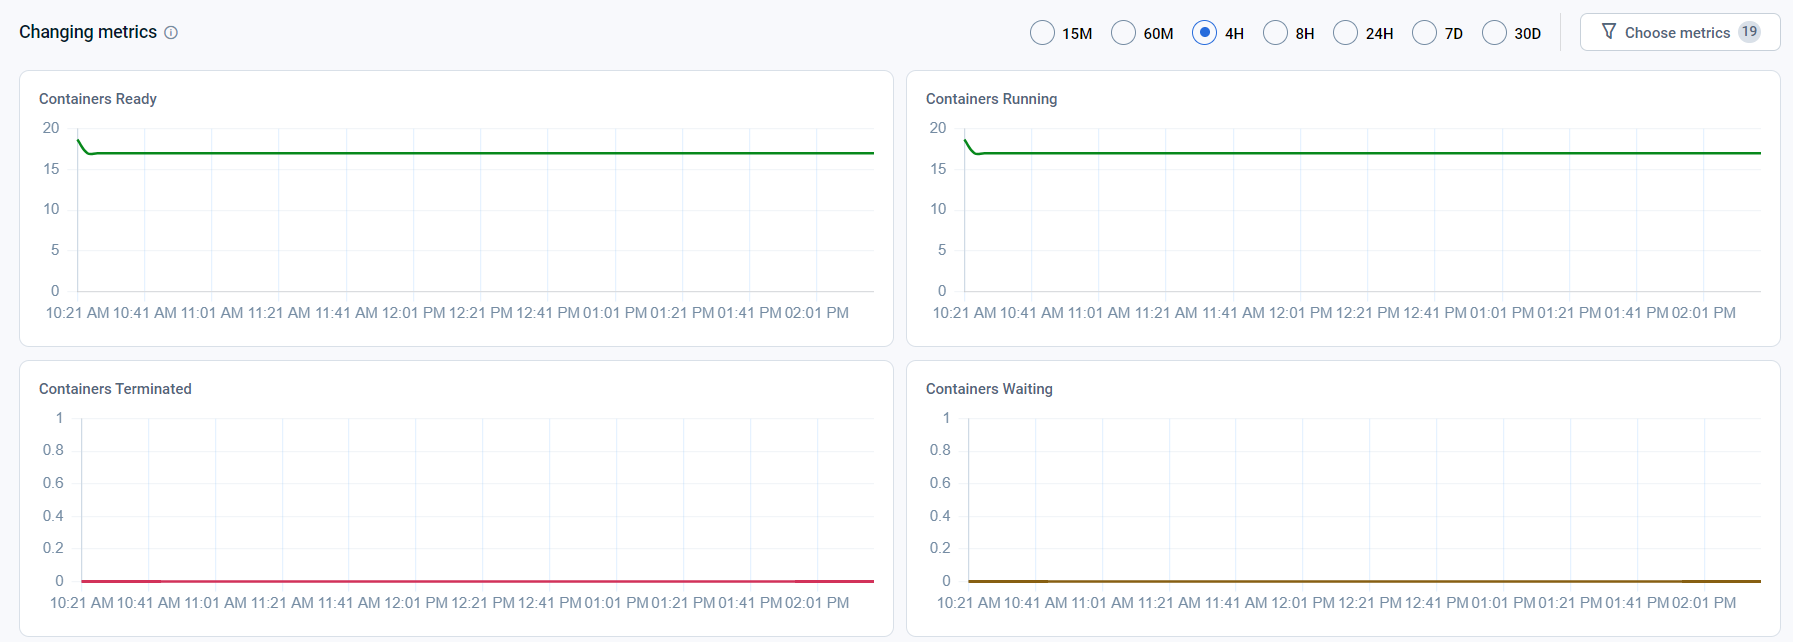
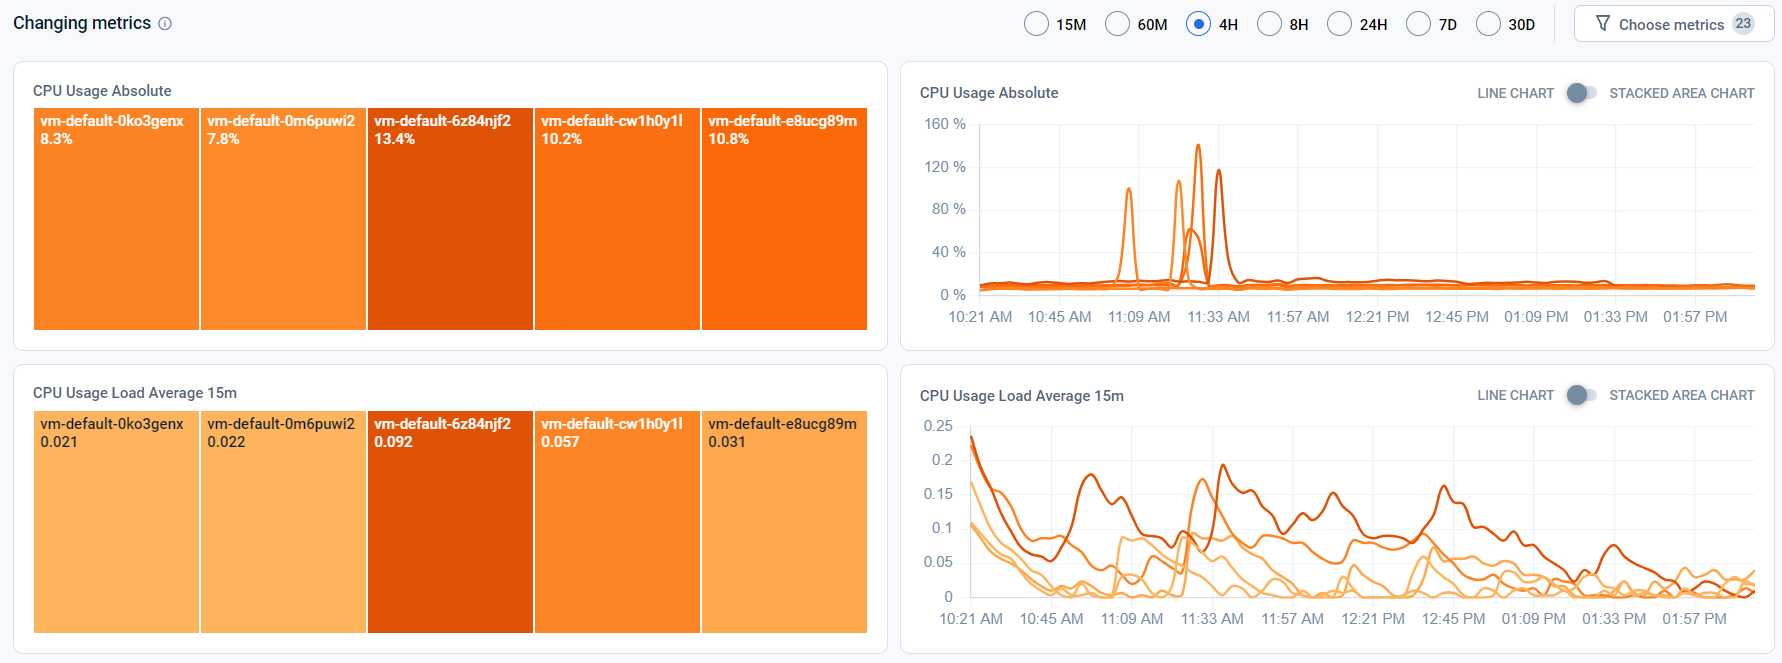
The "Changing Metrics" section consists of tools and charts for tracking historical changes in cluster metrics. This feature enables users to gain insights into the evolution of various metrics over time, aiding in data-driven decision-making.
This section consists of the following components:
- Choose Time Period. Users can select the time period they wish to analyze using this tool. It allows them to specify the timeframe for which they want to view metric changes, facilitating in-depth historical analysis. For example - 15M = 15 minutes, 4H = 4 hours and 7D = 7 days.
- Charts. Depending on the selected dashboard configuration, data within the "Changing Metrics" section can be displayed in one of the following ways:
- Single Line Line-Charts. When configured this way, data is presented in individual line-charts, enabling users to visualize the changing metrics for a specific object over time.
- Line-Charts with Multiple Lines and Treemap Charts. In this configuration, users can view line-charts featuring multiple lines, each representing the changing metric trends of different entities. Accompanying treemap charts illustrate the average value of the chosen metric for the selected period for each entity. This provides a more comprehensive overview of metric changes, especially when exploring different levels of detail via the "Choose Breakdown" tool.
The "Changing Metrics" section is a powerful feature within the UI, facilitating the tracking and analysis of historical performance data to inform decision-making.
The “States” section of metrics:
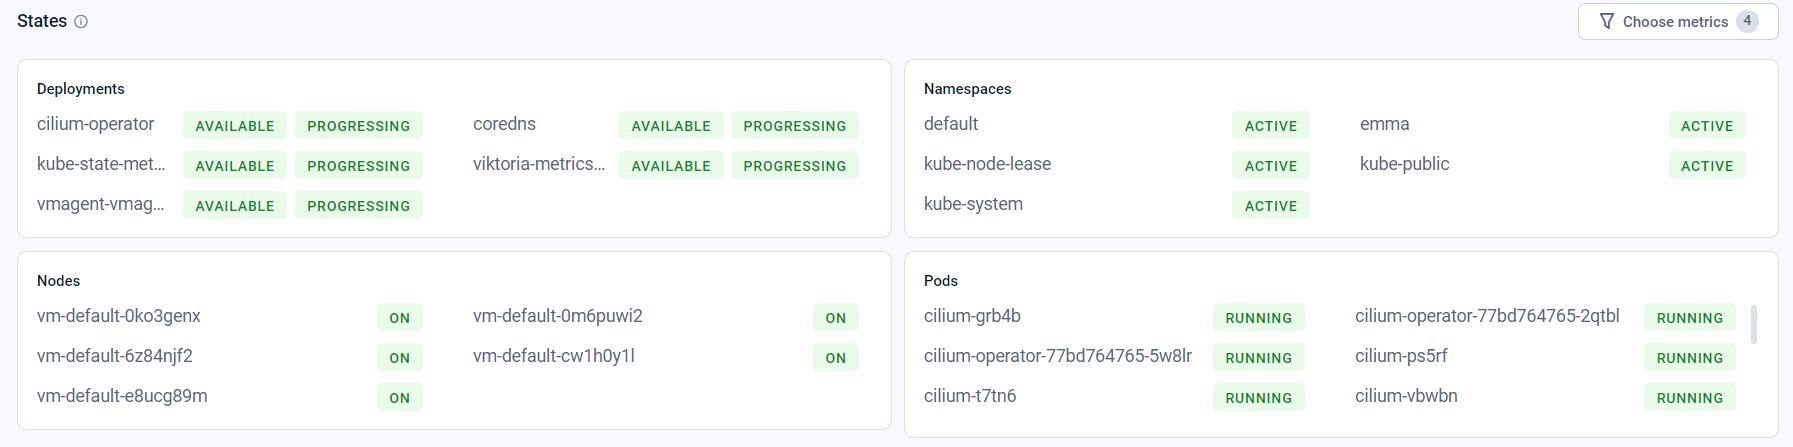
The "States" data section provides an overview of the various states of entities within the Kubernetes cluster. This essential feature allows users to understand the status of different components, such as namespaces, nodes, pods, and more, all in one place.
The "States" is a valuable resource for monitoring the health and status of entities within the Kubernetes cluster. It aids users in identifying issues, anomalies, or any combination of statuses that might impact the overall cluster's operation and performance.
Special opportunities
Choose configuration
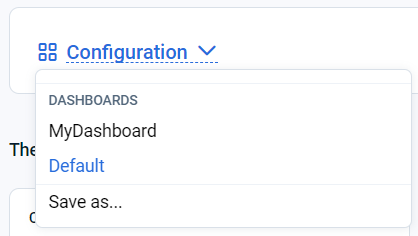
The "Choose Configuration" tool allows users to manage their Kubernetes monitoring dashboard configurations at the project level. These configurations are versatile and can be used across different clusters, offering users the flexibility to adapt their monitoring setup to various environments.
Key Functions:
- Create customized dashboards. Users can create and customize dashboard configurations tailored to their unique requirements, ensuring that they can focus on the most relevant information for their projects. These configurations are not restricted to a single cluster; users can use them across different clusters, promoting consistency and efficiency. To choose a configuration, users need to click on the configuration name and close the window. This allows for quick and straightforward switching between different setups.
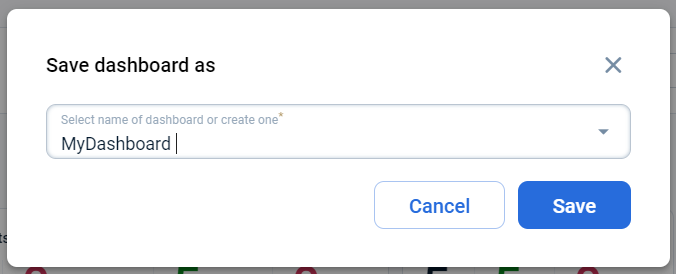
- Save a configuration. Once a customized dashboard configuration is created, users have the option to save it for future use. This functionality ensures that users can conveniently access and apply their preferred settings at any time, regardless of the cluster they are monitoring. To save a new configuration, users need to click on the "Save as" button and input a unique configuration name in the "Name of dashboard" placeholder. This name should differ from the existing list of configurations in the project.
- Change the configuration. Users can switch between different saved configurations to adapt the dashboard to varying monitoring needs, projects, or scenarios. This flexibility enables a seamless transition between configurations while working across multiple clusters. For modifying a configuration, users need to click on the "Save as" button and select the desired configuration from the "Name of dashboard" placeholder. This process ensures that users can apply their preferred settings for different monitoring contexts.
- Delete a configuration. If a configuration is no longer needed or relevant, users can remove it, maintaining a clutter-free and organized list of saved configurations. Deletion is a simple process, requiring users to hover the mouse over the configuration name and click the [X] button. Deleting a configuration is achieved by hovering the mouse cursor over the configuration name and clicking the [X] button. This method simplifies the removal of configurations no longer in use.
Filters
The "Filters" tool is a powerful feature that empowers users to refine the entities displayed on their dashboard based on specific conditions and criteria. It allows users to focus on the most relevant information and streamline their monitoring and analysis.
The "Filters" tool provides users with the ability to apply various filters, including:
- State of Entity. Users can filter entities based on their status, making it easy to identify and isolate entities in specific states within the cluster.
- CPU Utilization. This filter enables users to narrow down entities by their CPU utilization levels, ensuring a clear view of components that may be resource-intensive or underutilized.
- Memory Utilization. Users can filter entities by their memory utilization, making it straightforward to identify components that may be consuming excessive memory or those with available resources.
- Storage Usage. This filter helps users isolate entities based on their storage usage, allowing for a focused examination of components with storage-related issues or those with unused storage capacity.
- Selection of Objects. Users have the flexibility to handpick specific objects they wish to display on their dashboard.
The "Filters" tool is an indispensable resource that empowers users to tailor their dashboard's content to their precise requirements, ensuring that they can efficiently focus on the most relevant entities and conditions within the Kubernetes cluster.
Last updated on 1 Aug 2026