
Project Resource Allocation
Overview
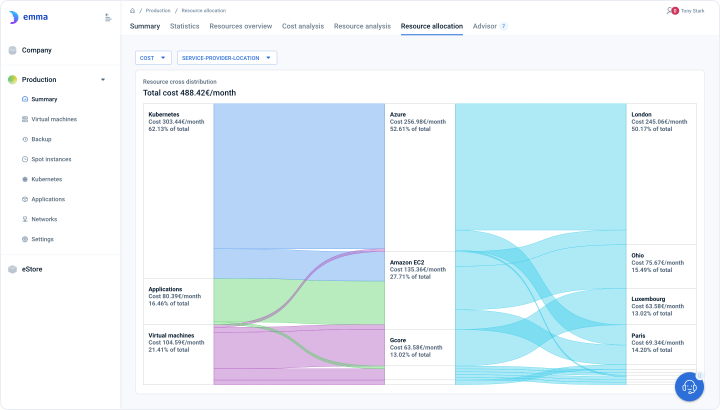
This graph allows the user to get an idea of the distribution of resources (cost, instances, CPU, memory, storage) in the project between services, providers and geographical locations
Analytics dashboard on page
Page navigation — Click on “All Projects“ and navigate to your project. You will be, by default on the project summary tab. Click on the “Resource allocation” tab.
This graph is a visual representation of the resource distribution within a project, highlighting various parameters such as cost, instances, CPU, memory, and storage, among others. It provides the user with an overview of the distribution of resources across various services, providers, and geographical locations.
For example, if a project has multiple services such as web servers, databases, and caching systems, this graph can help the user understand the distribution of resources across these services. The graph may show that the majority of resources are allocated to the web servers, followed by the databases and caching systems, respectively. It can also show the distribution of resources across different providers and geographical locations, which can be useful for optimizing resource allocation and cost management.
In addition, this graph can provide valuable insights into resource utilization patterns over time. By analyzing changes in resource distribution over time, the user can identify trends and make informed decisions about resource allocation and optimization.
Overall, this graph provides a powerful visualization tool for understanding the distribution of resources in a project and can help with cost management, resource allocation, and optimization.
Last updated on 1 Aug 2026