
Project Resources Analysis
Overview
This page provides an analysis of the different resources in the project and their level of utilization over a specified time period. The time period and the services filter can be modified/chosen by the user. the analysis will be provided based on the selected time period and service. By default, analysis reporting and dashboarding are done for the current month and all services.
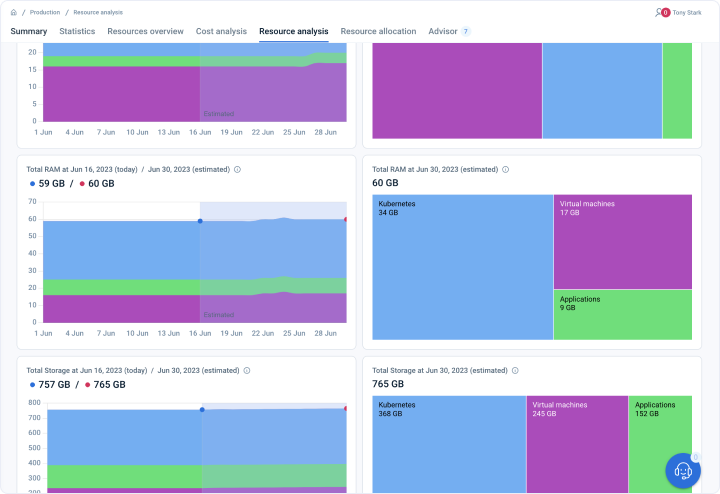
Analytics dashboard on page
How has the number of CPUs changed over time in my project? - FAQ
Page navigation — Click on “All Projects“ and navigate to your project. You will be, by default on the project summary tab. Click on the “Resource analysis” tab.
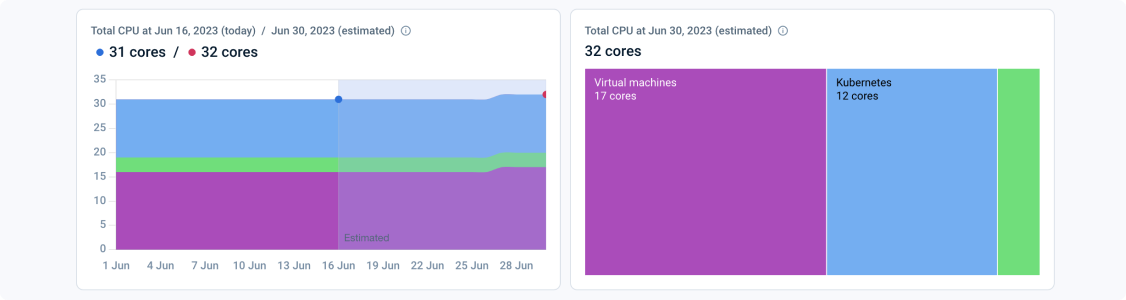
The first row of charts provides a view to understanding how the count of vCPUs has changed over time in your project. If the time period selected in the top filter is in future, the count of vCPUs is estimated using emma’s machine-learning backend models.
How can I track the changes in available memory (RAM) over time in my project? - FAQ
Page navigation — Click on “All Projects“ and navigate to your project. You will be, by default on the project summary tab. Click on the “Resource analysis” tab.
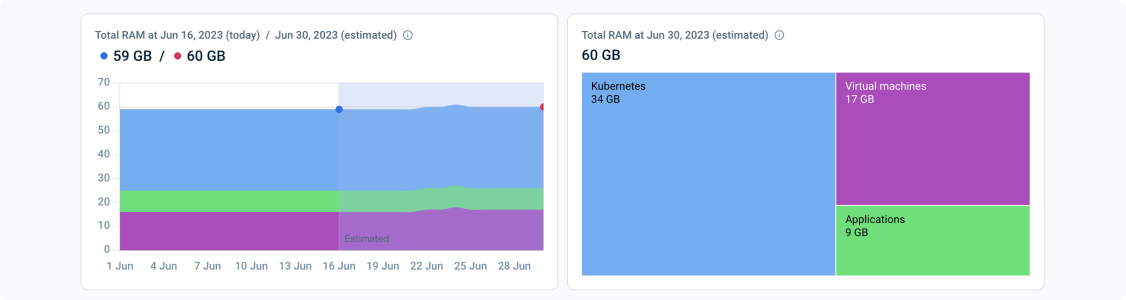
The second row of charts provides a view to understanding how the available memory (RAM) has changed over time in your project. If the time period selected in the top filter is in future, the available memory (RAM) is estimated using emma’s machine-learning backend models.
Where can I monitor the change of available storage over time in my project? - FAQ
Page navigation — Click on “All Projects“ and navigate to your project. You will be, by default on the project summary tab. Click on the “Resource analysis” tab.
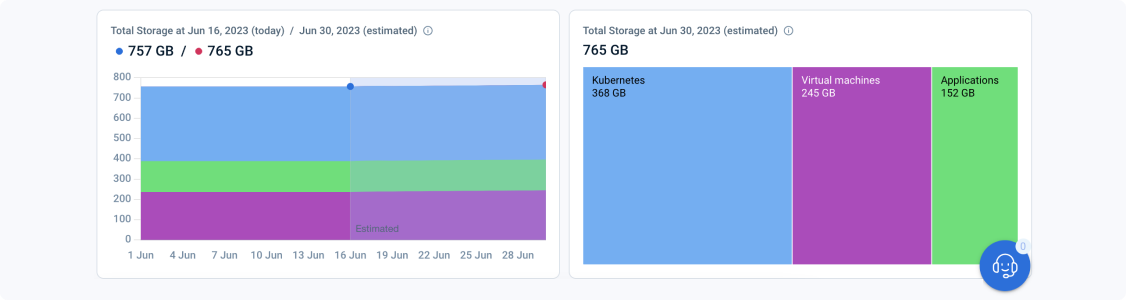
The third row of charts provides a view to understanding how the available storage has changed over time in your project. If the time period selected in the top filter is in future, the available storage is estimated using emma’s machine-learning backend models.
Last updated on 3 Aug 2023