
Project Statistics
Overview
On this page, users can explore insightful visual and analytical charts, including the count of active and inactive instances, their geographical locations, average vCPU and vRAM usage per hour, providers of products used in the project, associated costs, and storage usage.
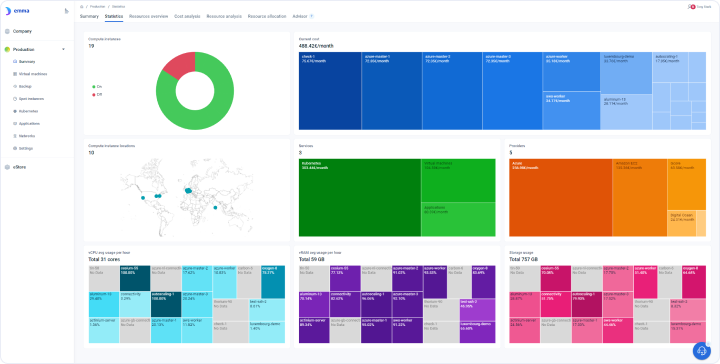
Analytics dashboard on page
Can I look at the status and count of all my VMs, from all types of services, in my project? - FAQ
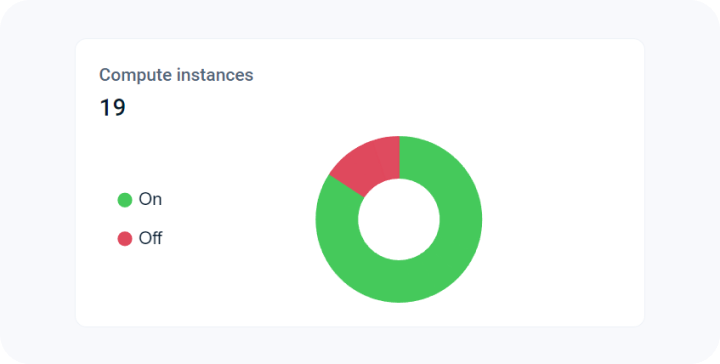
Page navigation — Yes, you can find that on the “Project statistics summary” page. You can navigate to your project from the home page by searching for your project. To search for a project, you can click on “View all” projects and search by project name.
The first chart in the first column is a pie chart which provides the count of VMs or “Compute instances”. It also breaks down the count based on the different states of the VMs like “On”, “Busy”, “Error” etc.
How can I find the geographical location of all my project VMs, from all types of services? - FAQ
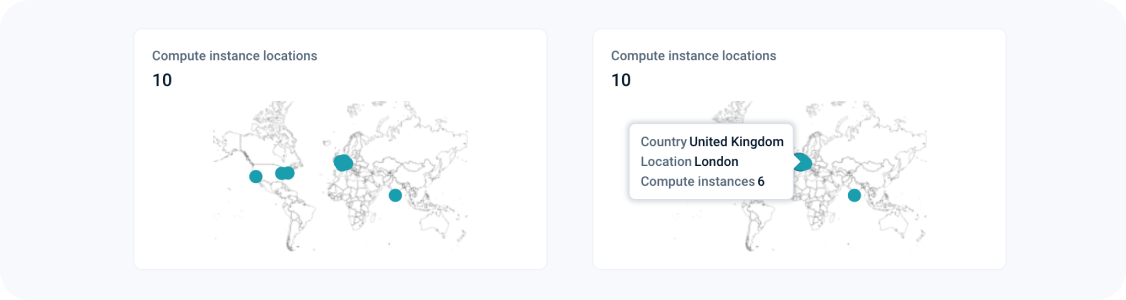
Page navigation — You can find that on the “Project statistics summary” page. You can navigate to your project from the home page by searching for your project. To search for a project, you can click on “View all” projects and search by project name.
The world map helps you visualize the geographical location of all your VMs. If you hover over the highlighted geographical locations, you can also find out the count of the VMs in that geographical location.
How can I see the breakdown of my project’s cost based on projects, services or cloud providers? - FAQ
Page navigation — Click on “All Projects“ and navigate to your project. You will be, by default on the project summary tab. Click on the “Statistics” tab.
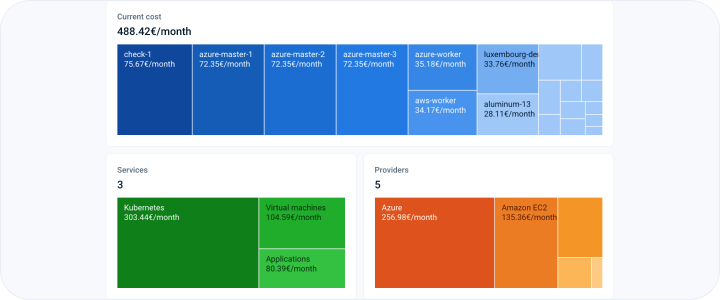
The first chart on the second column of the project statistics summary dashboard page provides a visual way of breaking down your costs in the form of a treemap chart. A treemap chart provides a hierarchical view of your data and makes it easy to spot patterns, such as which VMs or services or cloud platforms are costing you the most per month. There are three charts which break down costs based on:
- VMs defined in the project
- Services used in the project
- Cloud providers used in the project
Note: If you hover over the boxes in the cost breakdown by services or cloud providers, you can find out the count of the VMs in addition to the cost, from the tooltip.
What are vRAM and vCPU? - FAQ
vRAM
vRAM, short for virtual Random Access Memory, refers to the virtualized version of RAM (Random Access Memory) used in virtualized environments, such as virtual machines (VMs) and cloud computing platforms. vRAM is allocated to VMs to provide them with the necessary memory resources for running applications and storing data during their operation.
In a virtualized environment, vRAM is created by dividing the physical RAM of the host system into smaller chunks that are then allocated to individual VMs. Each VM typically has its dedicated vRAM, which is isolated from other VMs on the same host system. vRAM allows VMs to have their own memory space, independent of the physical RAM of the host system and other VMs, enabling multiple VMs to run concurrently on the same physical server.
vRAM allocation can be dynamically adjusted to meet the changing needs of VMs, allowing for efficient utilization of memory resources. However, it's important to carefully monitor and manage vRAM usage to avoid overcommitting or underprovisioning memory resources, as it can impact the performance and stability of VMs and the applications running on them.
vCPU
A vCPU, short for virtual Central Processing Unit, is a term used to describe the virtual representation of a CPU that is utilized in virtual machines (VMs) and cloud environments. Each vCPU within a VM's operating system corresponds to one physical CPU core.
Why are vCPUs important? → Businesses are increasingly leveraging VMs to optimize rack space, save time, and reduce management costs. VMs enable users to run multiple operating systems on a single physical machine, and vCPUs play a crucial role in ensuring the performance and efficiency of these VMs.
How can I find out the usage of CPU, memory and storage for all my VMs, from all types of services, in my project? - FAQ
Page navigation — Click on “All Projects“ and navigate to your project. You will be, by default on the project summary tab. Click on the “Statistics” tab.
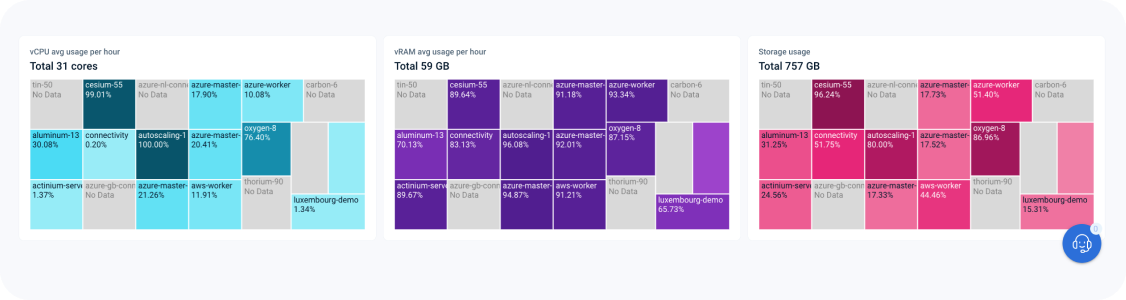
The bottom third of the page displays the CPU and memory usage for all virtual machines. In the vCPU and vRAM, each box represents a virtual machine. In the Storage chart there is information about virtual machines and their total utilization. Utilization for standalone volumes is currently unavailable.
The percentage mentioned in each box represents the percentage usage of that resource. The graphic also shows the total available resource at the top. The VMs need to be in an active and healthy state to return analytical data. This analytical data is then displayed in these graphics. So, if the VM is not active or in a shutdown/error state, emma will not be able to show meaningful data about that VM resource.
Watch the video about VM statistics
Last updated on 1 Aug 2026