
Spot instance - Monitoring
Overview
This page provides charts displaying trends over time regarding the average and maximum usage of:
- CPU
- RAM
- Storage
- Network “in” and “out” speeds in bps or Kbps
- Disk “read” and “write” speeds in bps or Kbps
Users can select the time period as well for different views and time-dependent resource trends. For example - 15M = 15 minutes, 4H = 4 hours and 7D = 7 days.
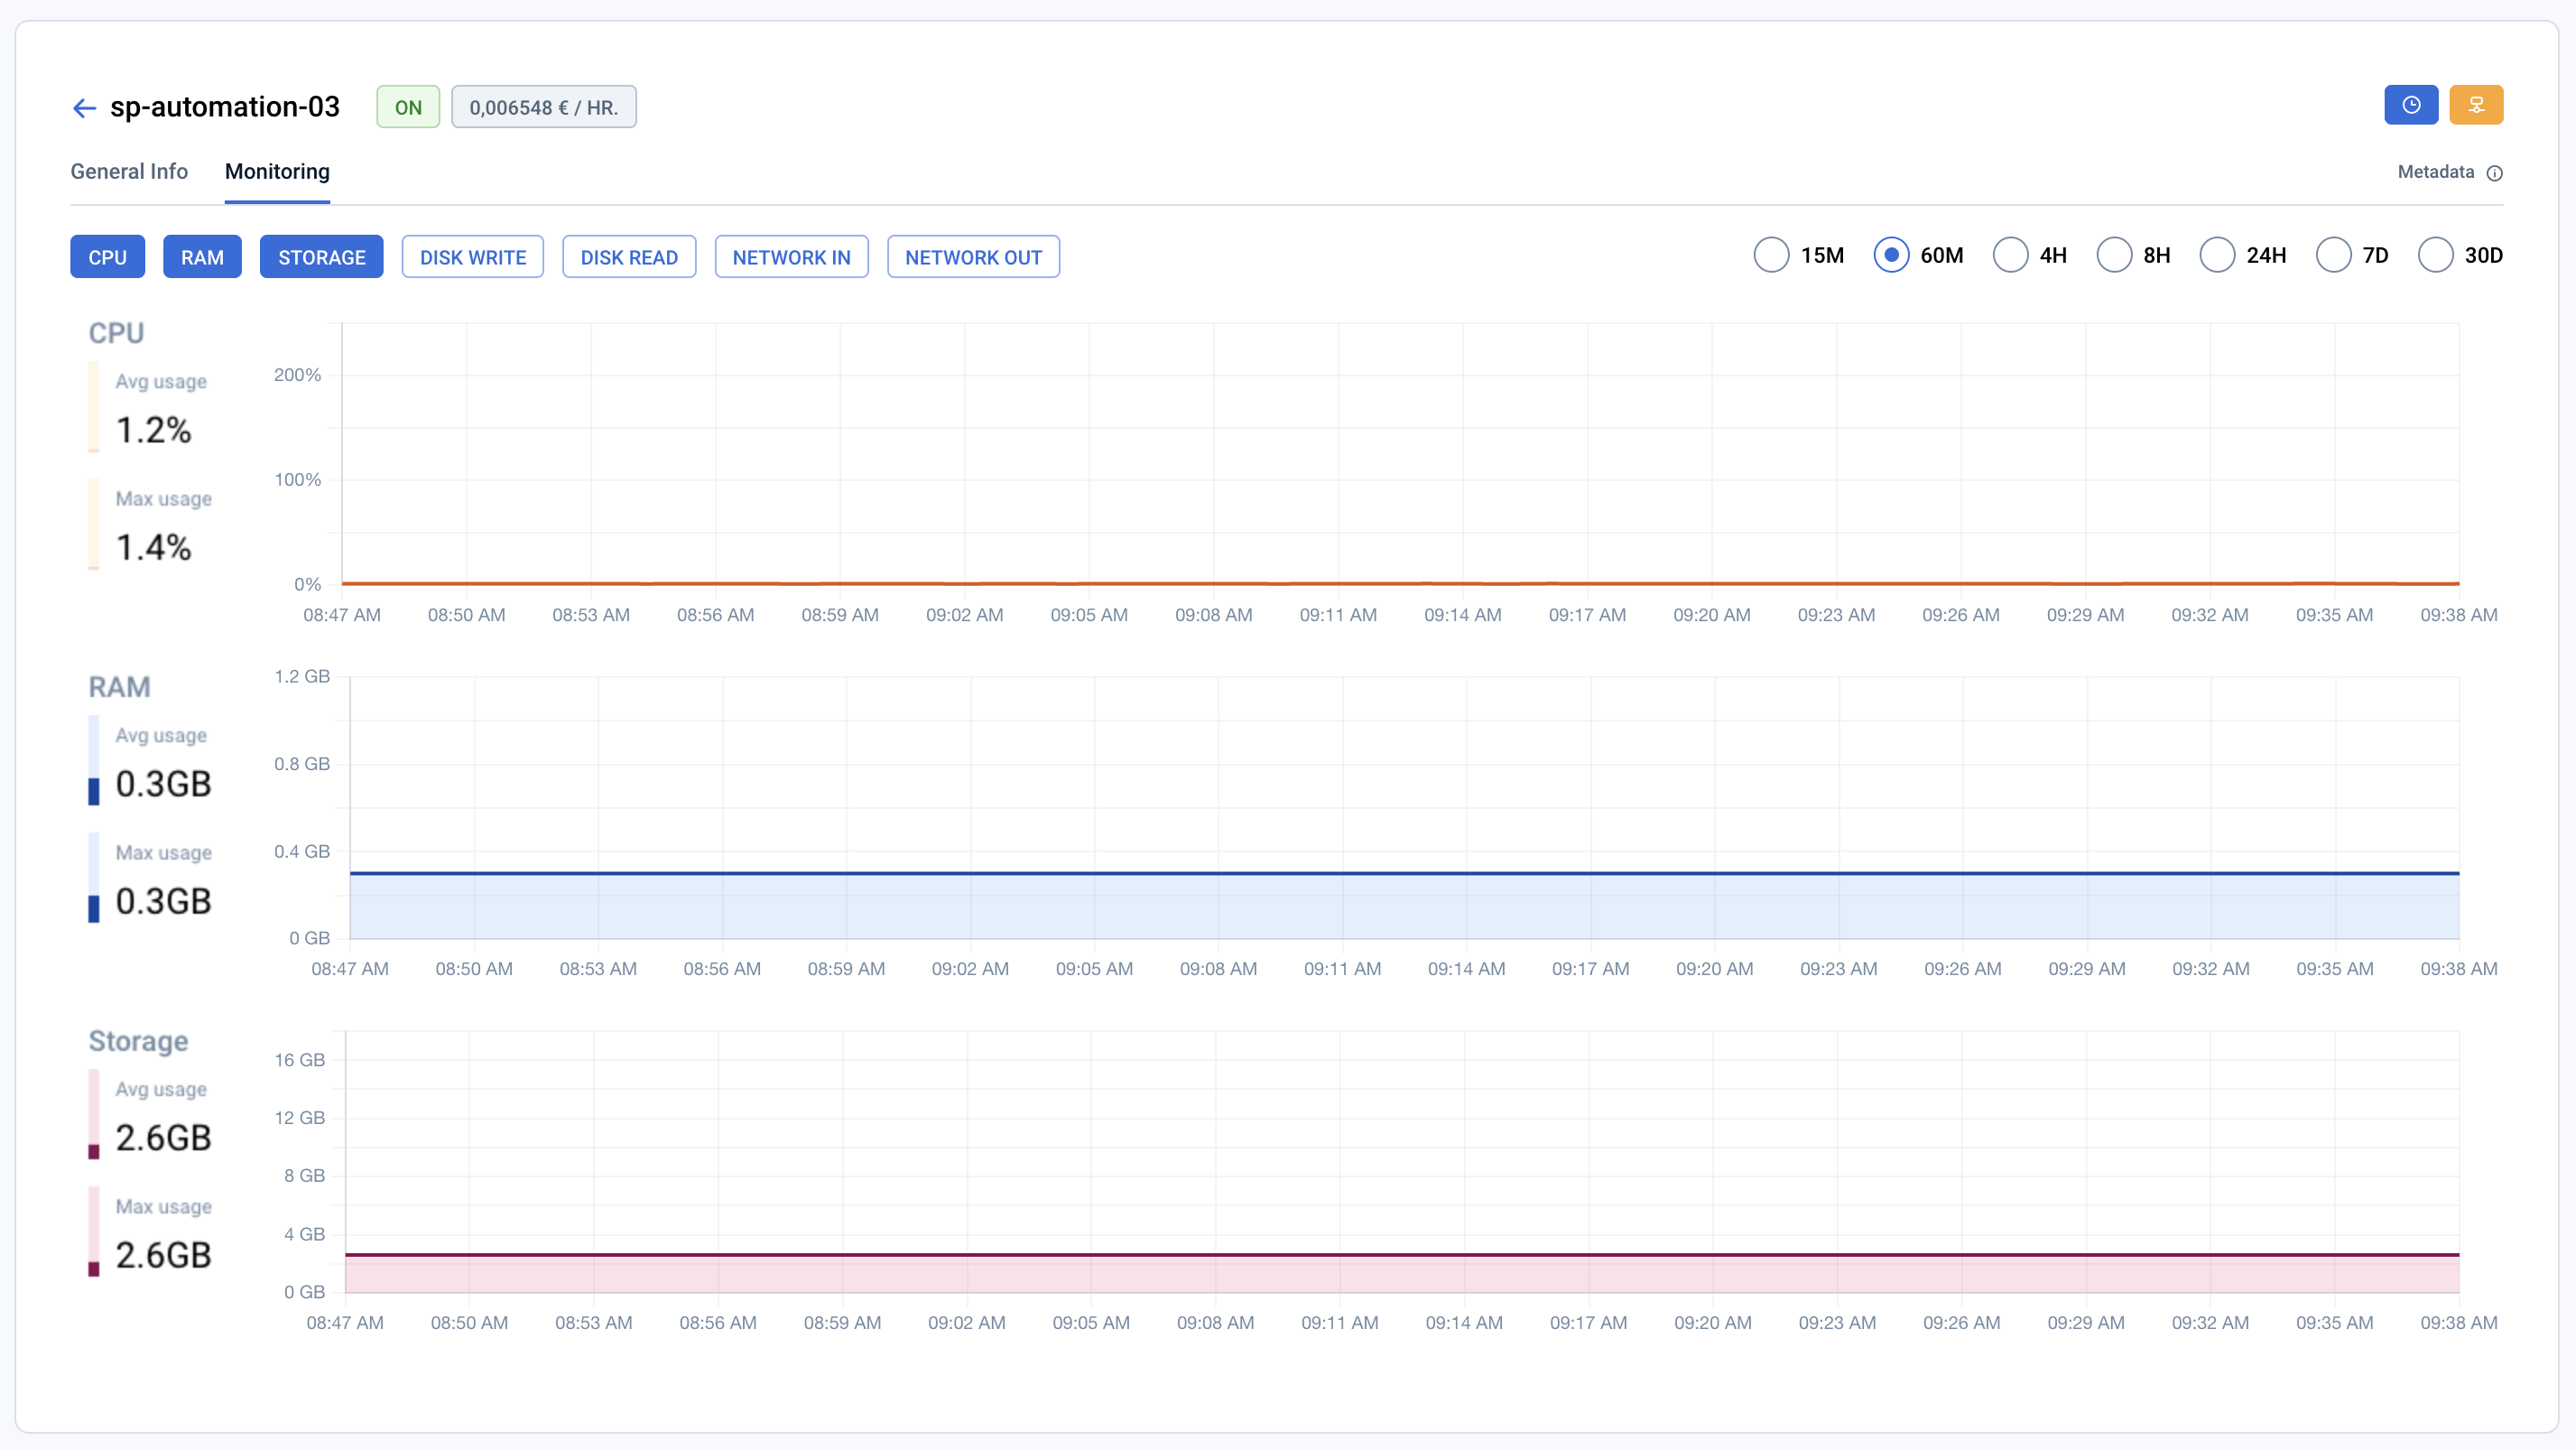
This page provides charts displaying trends over time regarding the average and maximum usage of the following resources:
- CPU: The CPU chart displays the average and maximum usage of CPU resources over time, enabling users to monitor their usage patterns and identify any potential performance issues. For example, if the CPU usage spikes above normal levels, it could indicate a problem with a specific application or workload.
- RAM: The RAM chart shows the average and maximum usage of memory resources over time. Users can monitor their usage patterns and identify any potential performance issues. If RAM usage spikes above normal levels, it could indicate that there is a memory leak in a specific application or workload.
- Storage: The storage chart displays the average and maximum usage of disk space over time. Users can monitor their storage usage patterns and identify any potential storage capacity issues. For example, if the storage usage reaches maximum capacity, it could lead to slow application performance or even data loss.
- Network “in” and “out” speeds in bps or Kbps: The network chart displays the average and maximum network speeds for both inbound and outbound traffic over time. Users can monitor their network usage patterns and identify any potential network performance issues. For example, if the network speed drops below normal levels, it could indicate that there is congestion on the network or a problem with a specific application.
- Disk “read” and “write” speeds in bps or Kbps: The disk chart shows the average and maximum disk read and write speeds over time. Users can monitor their disk usage patterns and identify any potential performance issues. For example, if the disk read or write speeds are consistently slow, it could indicate a problem with the storage infrastructure or a specific application.
In addition, users can select the time period for different views and time-dependent resource trends. For example, selecting 15M will display resource trends for the past 15 minutes, while selecting 7D will display resource trends for the past 7 days. This feature allows users to analyze resource usage patterns and identify any potential issues over different time periods.
Analytics on this page
Why do we monitor Spot instances? - FAQ
We monitor Spot instances for several reasons, including:
- Performance monitoring: Monitoring Spot instances allows us to track their performance metrics, such as CPU usage, memory usage, disk usage, and network traffic. This information is useful for identifying any performance bottlenecks, capacity issues, or resource constraints that may impact the Spot instance's performance.
- Security monitoring: Monitoring Spot instances also helps us detect any security threats or vulnerabilities. By monitoring the Spot instance's logs, network traffic, and system activity, we can identify any suspicious behavior or anomalies that may indicate a security breach.
- Availability monitoring: Monitoring Spot instances allows us to ensure that they are available and accessible to users. By monitoring the Spot instance's uptime, response times, and error rates, we can identify any issues that may impact its availability and take corrective action.
- Capacity planning: Monitoring Spot instances also helps us plan for future capacity needs. By analyzing the Spot instance's usage patterns and performance metrics, we can identify any trends or patterns that may indicate a need for additional capacity or resources.
Overall, monitoring Spot instances is essential for ensuring their optimal performance, availability, and security. It allows us to detect and address any issues that may impact the Spot instance's performance or availability, and to plan for future capacity needs.
How can I monitor my Spot instances in emma? - FAQ
This page provides charts displaying trends over time regarding the average and maximum usage of the following resources:
- CPU: The CPU chart displays the average and maximum usage of CPU resources over time, enabling users to monitor their usage patterns and identify any potential performance issues. For example, if the CPU usage spikes above normal levels, it could indicate a problem with a specific application or workload.
- RAM: The RAM chart shows the average and maximum usage of memory resources over time. Users can monitor their usage patterns and identify any potential performance issues. If RAM usage spikes above normal levels, it could indicate that there is a memory leak in a specific application or workload.
- Storage: The storage chart displays the average and maximum usage of disk space over time. Users can monitor their storage usage patterns and identify any potential storage capacity issues. For example, if the storage usage reaches maximum capacity, it could lead to slow application performance or even data loss.
- Network “in” and “out” speeds in bps or Kbps: The network chart displays the average and maximum network speeds for both inbound and outbound traffic over time. Users can monitor their network usage patterns and identify any potential network performance issues. For example, if the network speed drops below normal levels, it could indicate that there is congestion on the network or a problem with a specific application.
- Disk “read” and “write” speeds in bps or Kbps: The disk chart shows the average and maximum disk read and write speeds over time. Users can monitor their disk usage patterns and identify any potential performance issues. For example, if the disk read or write speeds are consistently slow, it could indicate a problem with the storage infrastructure or a specific application.
In addition, users can select the time period for different views and time-dependent resource trends. For example, selecting 15M will display resource trends for the past 15 minutes, while selecting 7D will display resource trends for the past 7 days. This feature allows users to analyze resource usage patterns and identify any potential issues over different time periods.
Last updated on 1 Aug 2026