
Budget card
Overview
The Budget card shows detailed information about a single budget, including its properties, a chart of cumulative costs over time, and — for recurrent budgets — a history of spending across past periods.
To access a Budget card, you need the Access FinOps management permission. Users with the Read company projects and project groups permission can open any budget card; users with the Read own projects and project groups permission can only open cards for budgets that cover their projects.
Use this page to understand how spending for a specific budget is tracking over time and to take management actions on that budget.
Content on this page
Page navigation — Navigation → Click on 'Company' → Click on 'Analytics Hub' → Go to 'Budgets' → Click on a budget row
Budget summary
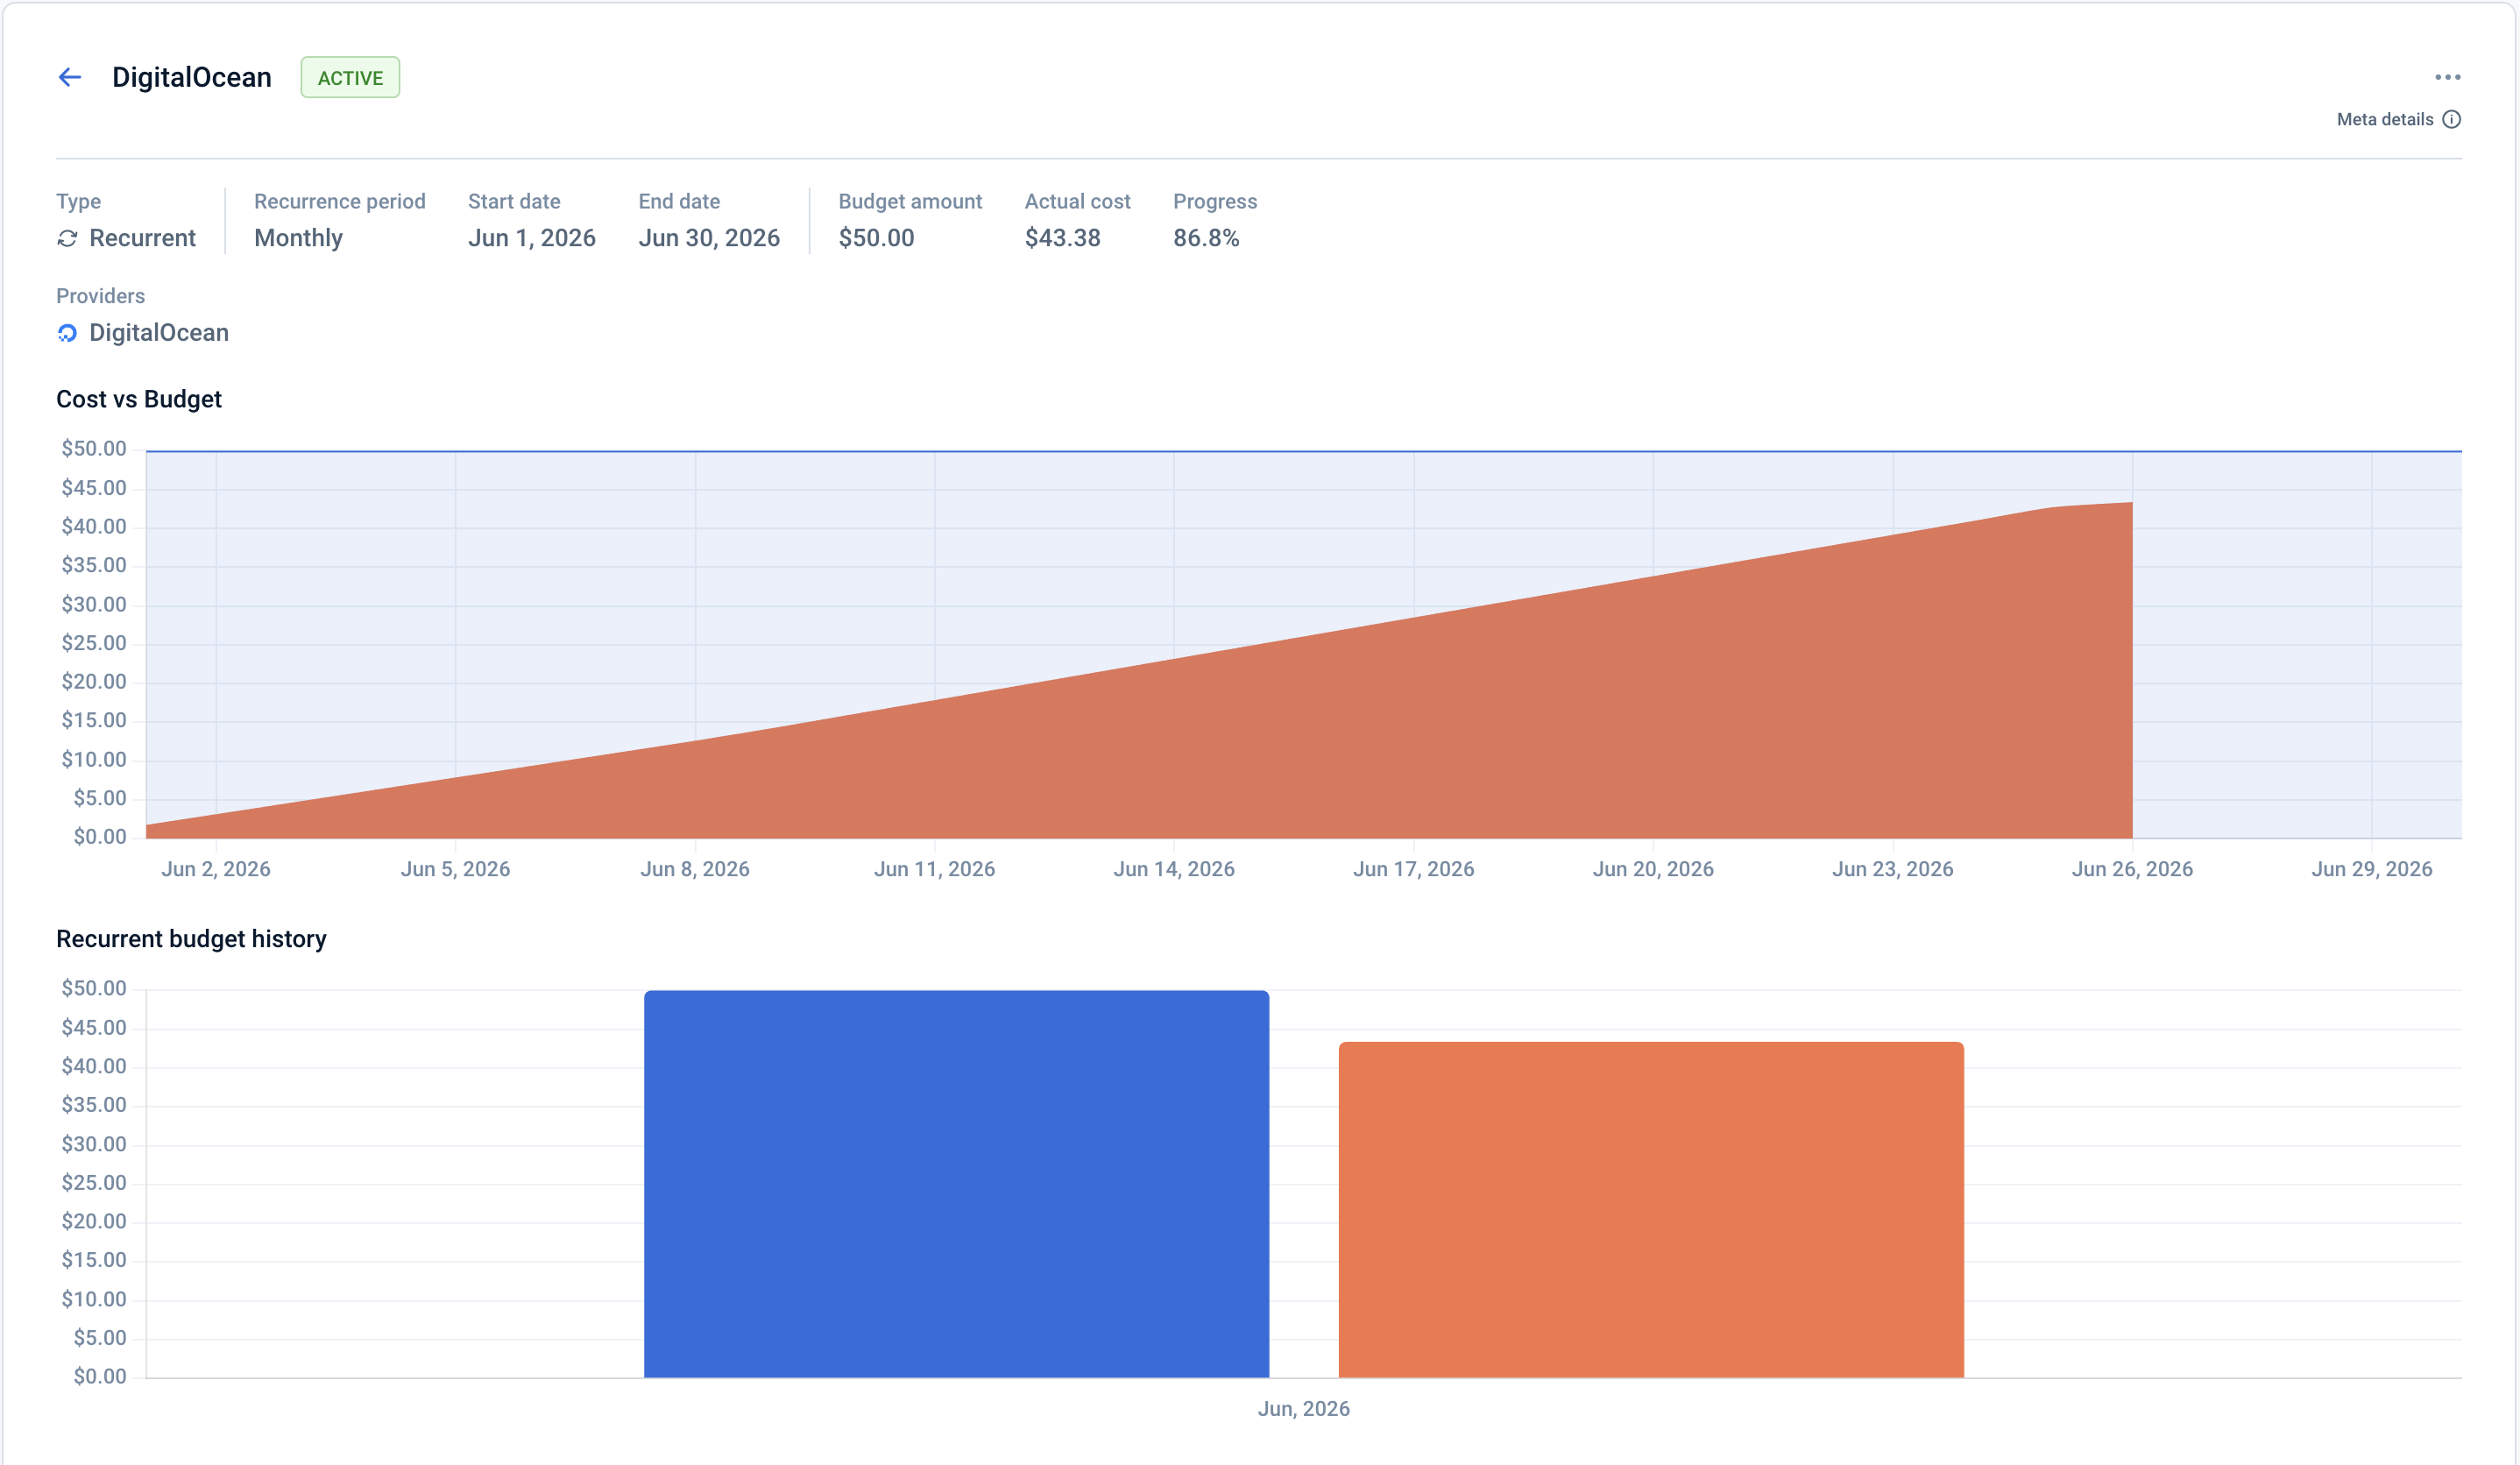
At the top of the page, a summary block shows the key properties of the budget:
- Name — The budget's name.
- Type — Expiring or Recurrent.
- Scope — The filters applied when the budget was created: projects, services, cloud providers, locations, and/or data sources. Data sources let you scope costs by billing origin — the built-in emma source (emma-provisioned resources) or an external cloud billing account (AWS, Azure, or GCP) connected on the Import page. Costs are counted only for resources that match all scope filters at the same time.
- Period — For recurrent budgets: Monthly, Quarterly, or Yearly. For expiring budgets: —.
- Start date — The date the budget period begins.
- End date — The date the budget period ends.
- Status — Planned, Active, or Expired.
- Budget amount — The spending limit for this budget.
- Actual cost — The total costs incurred so far within this budget's scope and period.
- Creation date — The date and time the budget was created (format: Month DD, YYYY HH:mm AM/PM GMT±timezone).
Cost vs Budget chart
The Cost vs Budget chart shows how cumulative cloud costs have progressed from the budget's start date toward its end date, compared against the budget limit.
- The horizontal line across the chart represents the budget amount.
- The filled area below the line represents cumulative actual cost, which grows as new costs are recorded.
- The color of the area reflects the same usage thresholds as the Spend bar on the Budgets page.
Hovering over any point on the chart shows a tooltip with the date (for example, Apr 22, 2026), the cumulative cost up to that date, and the percentage of the budget used.
Budget history chart
For recurrent budgets, a Budget history chart appears below the Cost vs Budget chart. It shows the budget amount and actual cost side by side for each billing period, from the first period to the current one.
- Each period is shown as a pair of bars: one for the budget amount and one for the actual cost.
- The current period is visually highlighted.
Actions that you can perform on this page
On the Budget card you can perform the following actions:
- Edit this budget — Click Edit to change the budget's name, scope, end date (for expiring budgets), or amount. The budget type and recurrence period cannot be changed after the budget is created.
- Delete this budget — Click Delete and confirm the action. You are returned to the Budgets page after deletion.
Last updated on 12 Aug 2026