
Company Summary
When you signup and register, emma asks for your details and sets up the company structure with projects, users, permissions sets, and project roles in them. Company is the logical structure within which all your projects reside. Within each of your projects, you can deploy services which cost every month.
Overview
This page provides a graphical as well as quantitative summary dashboard of all the active projects going on in the company. This page tells you about the following:
- Cost of all projects
- Usage/consumption of CPU, memory and storage
- Breakdown of the cost based on projects, services and providers
You can also launch services from this page by just selecting an existing project or creating a new project
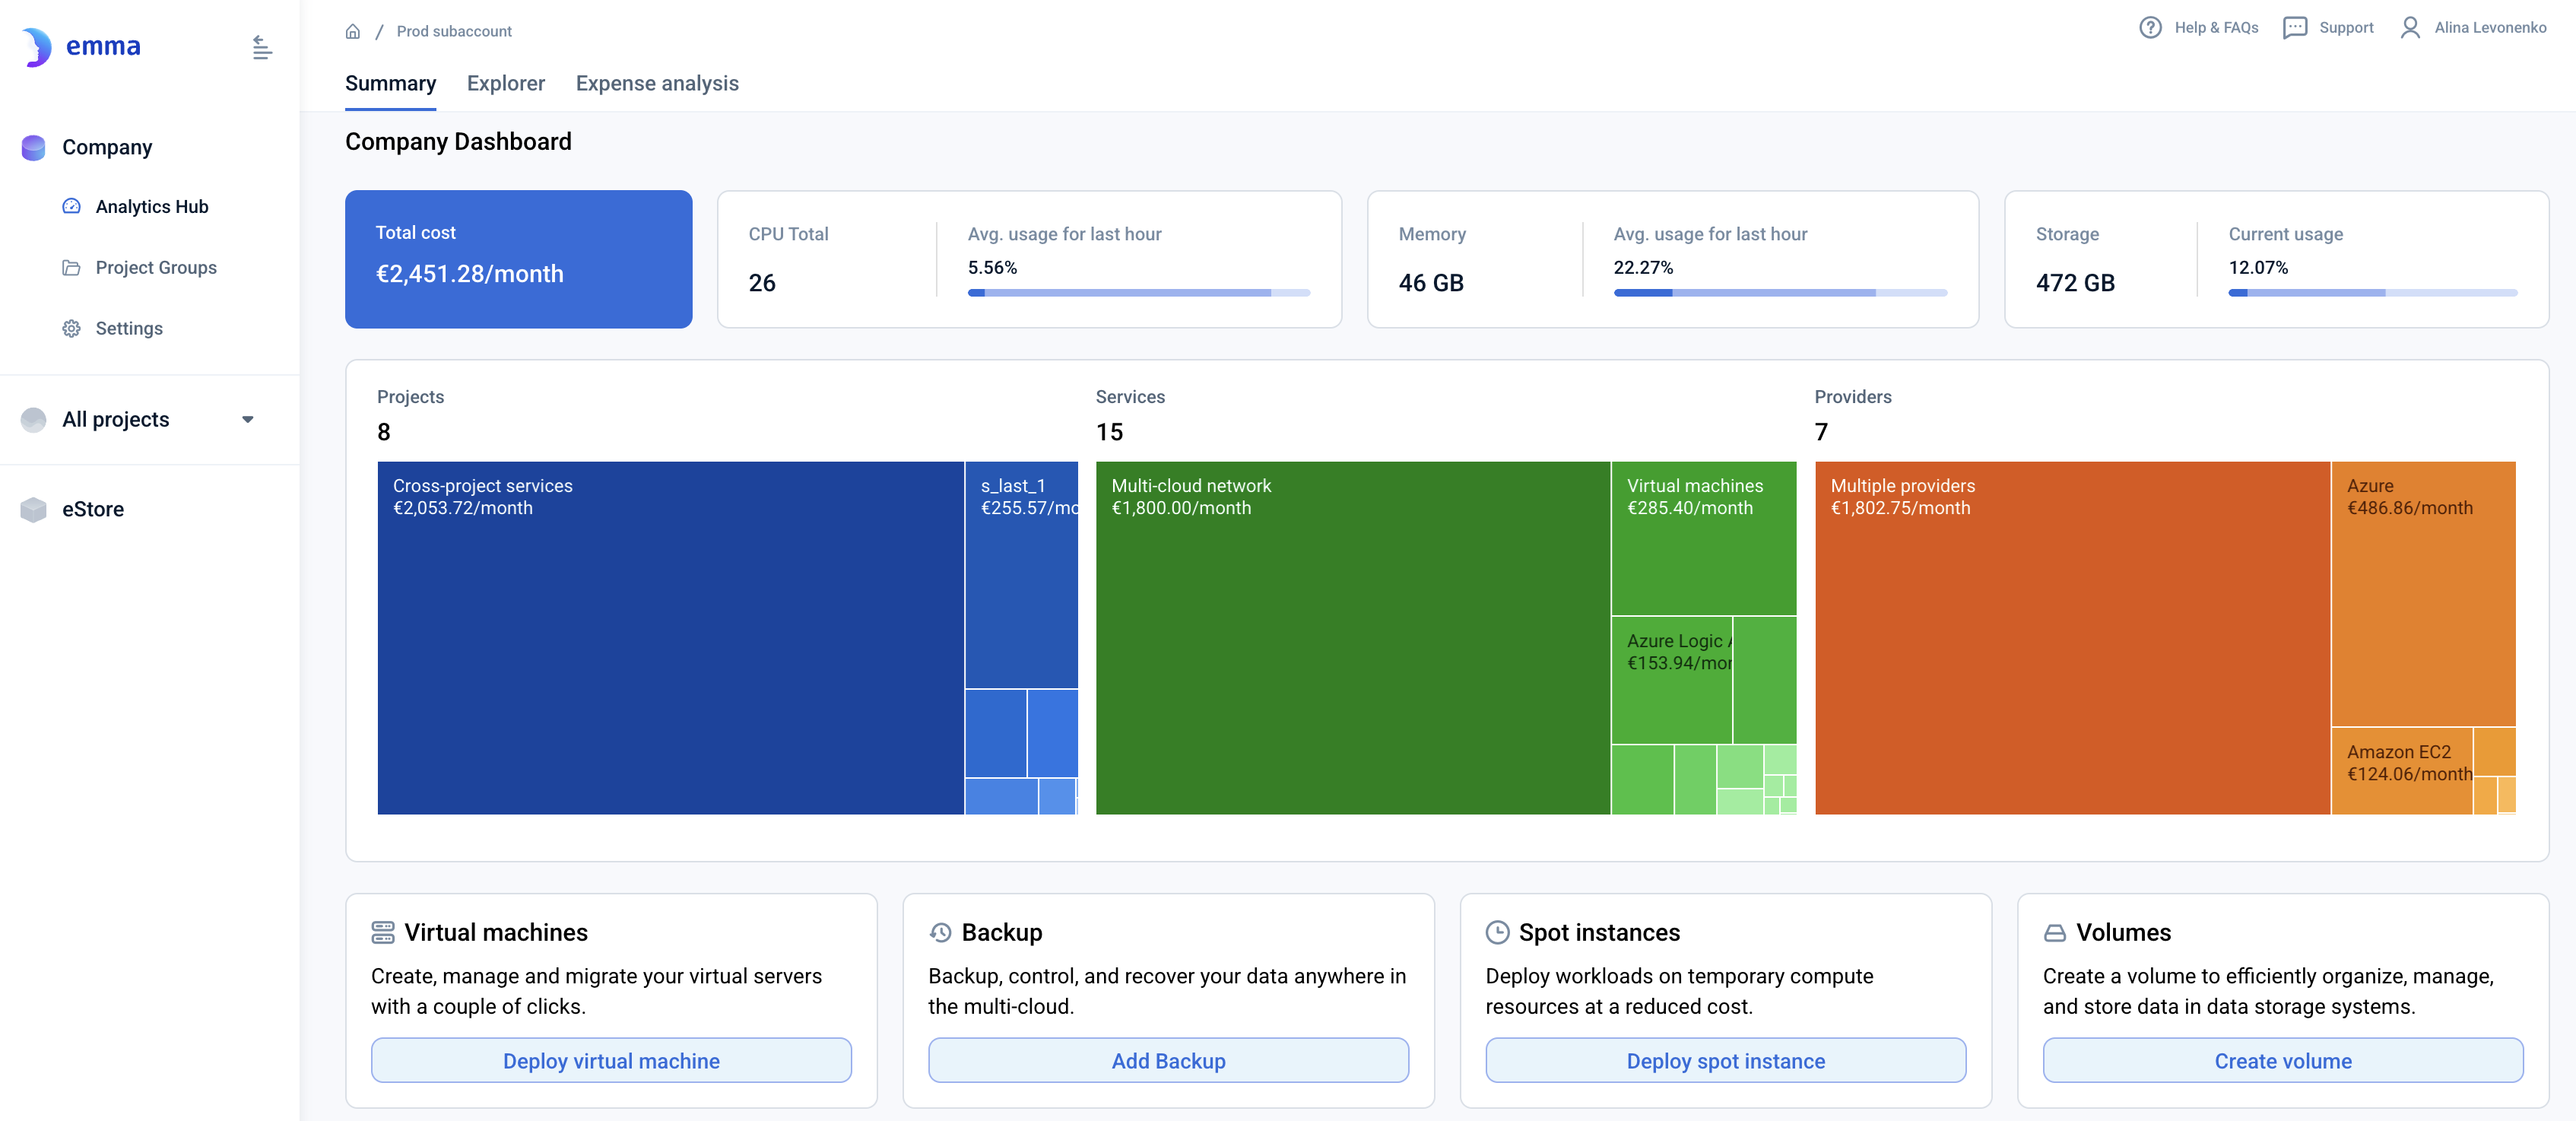
Analytics on page
How do I find the total cost of all my projects in the company? - FAQ
You can have many projects in your company, created by different users. Each of those projects can have active services running within them. Each of those services has cost associated with them which is displayed prominently. As a cost-effective cloud platform, we want to keep your cost as low as possible and visible to you at all times. You can monitor the total cost of the active services per month, in all your projects, in your company. Please follow the below steps:
Page navigation — Click on Company → Summary
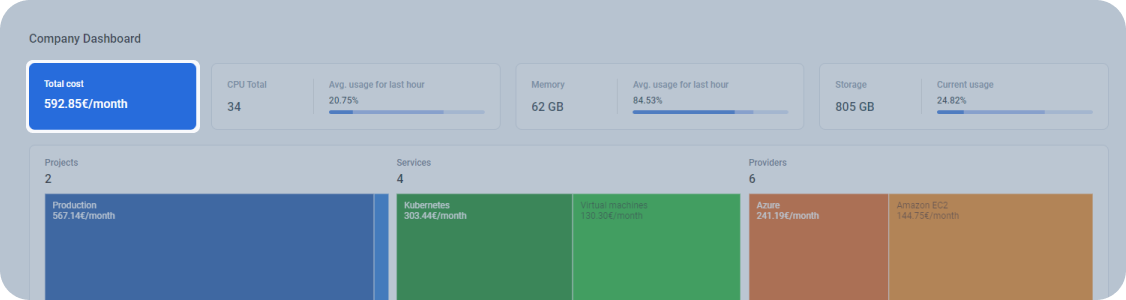
The first graphic on this page displays the total cost rate per month for all the active projects going on in the company
Returning users with active projects view
It's important to note that the data displayed on the company dashboard is only for your projects or projects you have access to based on your assigned roles and permission sets. This ensures that you're seeing the most accurate and relevant information for your needs.
New users view
If you're a new user and don't have any active services yet, you will see the below screen.
To create your first project, click on the LAUNCH SERVICES → button and follow the step-by-step instructions. Once your project is up and running with active services, you can monitor important metrics like the total cost of your projects, their CPU usage, memory usage, and storage usage from your company dashboard.

What is the total usage of CPU, memory and storage for all my projects in the company? - FAQ
In your company, you may have multiple VMs and spot instances running based on your configurations and settings in each of your projects. You can monitor important metrics relevant to your active services from a central location.
Page navigation — Navigation → Click on 'Company' and then go to 'Summary'.
The first graphic you'll see on this page displays some important metrics that you might you need. Plus, you can hover over these metrics to get an extra layer of information regarding the resources and usage. Check out the screenshots below to see how it looks and functions.
CPU usage
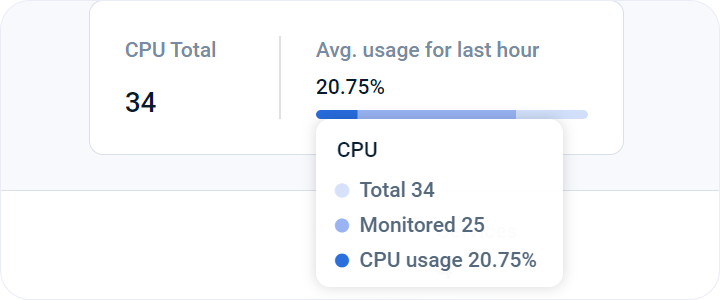
On the company dashboard, you can check out the average per cent CPU usage for the last hour. It is the second graphic box that displays the total count of CPUs in all your projects. It is helpful to understand and monitor the load on the services of your active projects.
If you hover over the CPU usage metric you will see another layer of info. You will get the following info from the graphic:
- CPU Total - The count of all CPUs in all the services in your projects
- Monitored - This is the number of CPUs that are monitored for example CPUs in dedicated VMs are monitored. Spot instances are not monitored.
- Average CPU usage for the last hour in per cent - It's important to note that the average per cent CPU usage for the last hour only shows usage for active instances which are not in a shutdown state. Additionally, spot instances are not monitored.
Spot instances are a type of compute instance that allows you to take advantage of unused VM capacity in different cloud providers. They are typically less expensive than other instance types, but they may not always be available.
Memory usage
Page navigation — Click on 'Company' followed by 'Summary'.
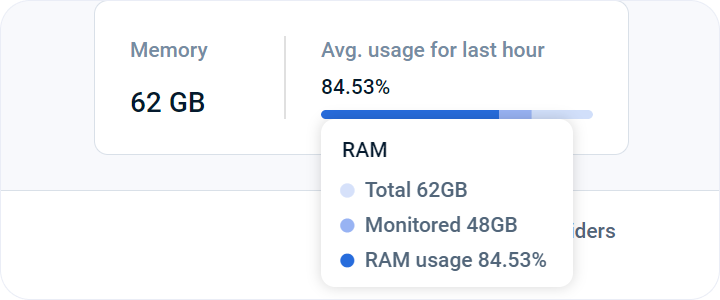
The third graphic box displays memory usage metrics, and you can hover over them to get more details. The hover graphic shows the total sum of the monitored RAM and the total RAM available.
You can find out the following information from the graphic:
- Total Memory - This is the total of all the RAM available in the VMs and spot instances running in your project services
- Monitored - This is the total of all the RAM available in only the VMs. Spot Instances are not monitored
- Average memory usage for last hour in per cent - It's important to note that the average per cent memory usage for the last hour only shows usage for active instances which are not in a shutdown or terminated state. Additionally, spot instances are not monitored.
Spot instances are a type of compute instance that allows you to take advantage of unused VM capacity in different cloud providers. They are typically less expensive than other instance types, but they may not always be available.
It's a convenient way to stay informed about your memory usage and ensure smooth operations for your projects.
Storage usage
Page navigation — To monitor storage usage for your company, you can navigate to 'Company' and then 'Summary'.
The fourth box in the first graphic displays the storage usage metric. If the machine is in terminated and shutdown state, it will not be considered in this metric. You can hover over the metrics for more info about the total and monitored storage available.
You can find out the following information from the graphic:
- Total Storage - This is the total of all the storage available in the VMs, spot instances and volumes exisitng in your project services
- Monitored - This is the total of all the storage available in virtual machines and volumes. Spot Instances are not monitored
- Average storage usage for last hour in per cent - It's important to note that the average per cent storage usage for the last hour takes into account the storage usage of machines that were recently shut down. Additionally, spot instances are not monitored.
Spot instances are a type of compute instance that allows you to take advantage of unused VM capacity in different cloud providers. They are typically less expensive than other instance types, but they may not always be available.
It's a user-friendly way to stay on top of your storage usage and ensure you have enough space for your projects. Additionally, spot instances are not monitored. Spot instances are a type of compute instance that allows you to take advantage of unused VM capacity in different cloud providers. They are typically less expensive than other instance types, but they may not always be available.
How can I see the breakdown of my company's cost based on projects, services or cloud providers? - FAQ
Page navigation — Click on “Company“ to navigate to the “Company summary” page.
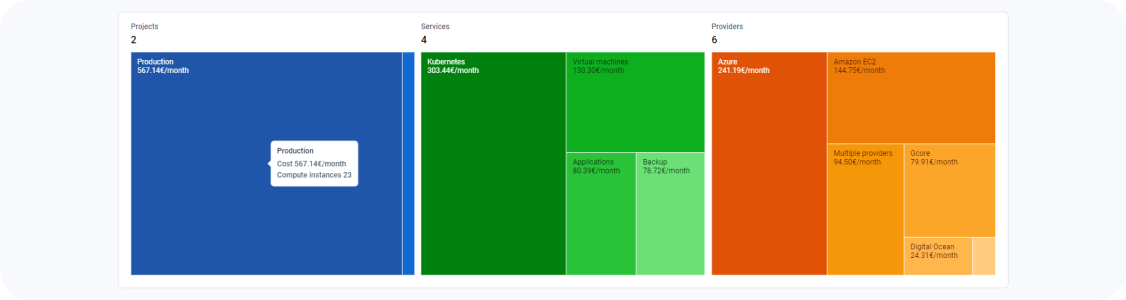
The graphic on the second row of the company dashboard page provides a visual way of breaking down your costs in the form of a treemap chart. A treemap chart provides a hierarchical view of your data and makes it easy to spot patterns, such as which projects or services or cloud platforms are costing you the most per month. There are three charts which break down costs based on:
- Projects defined in the company
- Services used in the projects
- Cloud providers of the project services
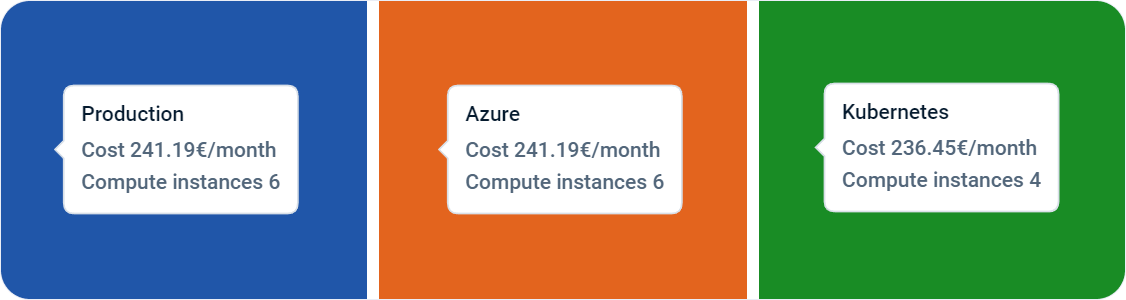
Note: If you hover over the boxes you can also find out the corresponding compute instances active in that specific project or service or cloud provider.
Some tooltips examples are as follows:
New users view
If you're a new user and don't have any active services yet, you will see the below screen.
To create your first project, click on the LAUNCH SERVICES → button and follow the step-by-step instructions. Once your project is up and running with active services, you can monitor important metrics like the total cost of your projects, their CPU usage, memory usage, and storage usage from your company dashboard.

Actions you can perform on this page
To get started, click on the button for the action you want to perform. Before you can take action like deploying a VM, you'll need to select an existing project or create a new project, in which the VM will be deployed.
Here are the actions you can perform on your projects:
- DEPLOY A VM: Easily deploy a virtual machine and get it up and running quickly. For more detailed help on this topic, refer: Create VMs
- ADD A BACKUP POLICY: Keep your data safe and secure by adding a “backup policy” to your project. For more detailed help on this topic, refer to: Create a Backup Policy
- DEPLOY A SPOT INSTANCE: Take advantage of unused VM capacity in different cloud providers by deploying a spot instance. For more detailed help on this topic, refer: Create Spot Instance
- CREATE A VOLUME: Organize and store your data effectively by creating a volume. For more detailed help on this topic, refer to All volumes instruction
- DEPLOY A KUBERNETES CLUSTER: Manage your containers with ease by deploying a Kubernetes cluster. For more detailed help on this topic, refer to: Create Kubernetes (K8s) cluster
- DEPLOY AN APPLICATION: Deploy your application and get it up and running on the emma multi-cloud platform. For more detailed help on this topic, refer to:Create an application
With these options, you can customize your experience and take control of your projects.
Last updated on 1 Aug 2026