
Analytics
PAGE
Overview
This page provides a forecast of VM resource utilization and a detailed statistical analysis.
Analytics on this page
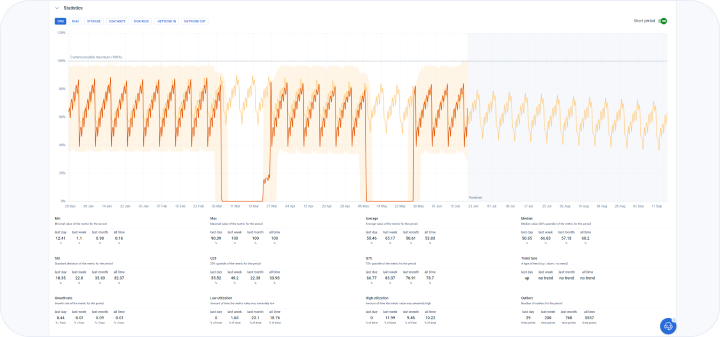
This page displays a lot of statistical information regarding VM monitoring.
You can find charts displaying trends over time regarding past, current and forecasted metric values. The VM monitoring metrics are as follows:
- CPU utilization
- RAM utilization
- Storage utilization
- Network “in” and “out” speeds in bps or Kbps
- Disk “read” and “write” speeds in bps or Kbps
In addition to the charts, you can find twelve different statistical measurements regarding the VM metrics mentioned above. In other words, for each of the VM metrics mentioned above emma provides twelve different statistical measurements mentioned below:
- Min - This denotes the Minimal value of the metric for the period. This section is further broken down into statistical measurements for the following time periods:
- last day. For example, a sample value can be 819.2 MB
- last week. For example, a sample value can be 819.2 MB
- last month. For example, a sample value can be 819.2 MB
- "all time". For example, a sample value can be 819.2 MB
- Max - This denotes the Maximal value of the metric for the period. This section is further broken down into statistical measurements for the following time periods:
- last day. For example, a sample value can be 952.32 MB
- last week. For example, a sample value can be 952.32 MB
- last month. For example, a sample value can be 952.32 MB
- "all time". For example, a sample value can be 952.32 MB
- Average - This denotes the Average value of the metric for the period. This section is further broken down into statistical measurements for the following time periods:
- last day. For example, a sample value can be 862.01 MB
- last week. For example, a sample value can be 862.01 MB
- last month. For example, a sample value can be 862.01 MB
- "all time". For example, a sample value can be 862.01 MB
- Median - This denotes the Median value (50% quantile) of the metric for the period. This section is further broken down into statistical measurements for the following time periods:
- last day. For example, a sample value can be 870.4 MB
- last week. For example, a sample value can be 870.4 MB
- last month. For example, a sample value can be 870.4 MB
- "all time". For example, a sample value can be 870.4 MB
- Std - This denotes the Standard deviation of the metric for the period. This section is further broken down into statistical measurements for the following time periods:
- last day. For example, a sample value can be 26.77 MB
- last week. For example, a sample value can be 26.79 MB
- last month. For example, a sample value can be 26.79 MB
- "all time". For example, a sample value can be 26.79 MB
- Q25 - This denotes the 25% quantile of the metric for the period. This section is further broken down into statistical measurements for the following time periods:
- last day. For example, a sample value can be 829.44 MB
- last week. For example, a sample value can be 829.44 MB
- last month. For example, a sample value can be 829.44 MB
- "all time". For example, a sample value can be 829.44 MB
- Q75 - This denotes the 75% quantile of the metric for the period. This section is further broken down into statistical measurements for the following time periods:
- last day. For example, a sample value can be 870.4 MB
- last week. For example, a sample value can be 870.4 MB
- last month. For example, a sample value can be 870.4 MB
- "all time". For example, a sample value can be 870.4 MB
- Trend type - This denotes the type of trend (up / down / no trend) for the metric for the period. This section is further broken down into statistical measurements for the following time periods:
- last day. For example, a sample value can be "down"
- last week. For example, a sample value can be "down"
- last month. For example, a sample value can be "down"
- "all time". For example, a sample value can be "down"
- Growth rate - This denotes the Growth rate of the metric for the period. This section is further broken down into statistical measurements for the following time periods:
- last day. For example, a sample value can be -2.15 MB / hour
- last week. For example, a sample value can be -2.15 MB / hour
- last month. For example, a sample value can be -2.15 MB / hour
- "all time". For example, a sample value can be -2.15 MB / hour
- Low utilization - This denotes the amount of time the metric value was extremely low for the period. This section is further broken down into statistical measurements for the following time periods:
- last day. For example, a sample value can be "0% of the time"
- last week. For example, a sample value can be "0% of the time"
- last month. For example, a sample value can be "0% of the time"
- "all time". For example, a sample value can be "0% of the time"
- High utilization - This denotes the amount of time the metric value was extremely high. This section is further broken down into statistical measurements for the following time periods:
- last day. For example, a sample value can be "0% of the time"
- last week. For example, a sample value can be "0% of the time"
- last month. For example, a sample value can be "0% of the time"
- "all time". For example, a sample value can be "0% of the time"
- Outliers - This denotes the number of outliers for the period. This section is further broken down into statistical measurements for the following time periods:
- last day. For example, a sample value can be "6-time points". This means that there were six outliers in this time period.
- last week. For example, a sample value can be "6-time points". This means that there were six outliers in this time period.
- last month. For example, a sample value can be "6-time points". This means that there were six outliers in this time period.
- all time. For example, a sample value can be "6-time points". This means that there were six outliers in this time period.
• You can hover over the trend line to see the actual value as well as the value that was predicted by emma’s predictive machine learning models. The section of the graph which is in the future and a value is predicted, you will notice that there is no actual value as of now. You an only see the modelled/predicted value. • Each of the charts show the maximum possible capacity levels as well along with the actual and predicted values • You can select the metric and also select to look at the graph for a shorter time period. You just need to activate the “Short period” slider
Watch the video about VM analytics
Last updated on 1 Aug 2026