
Monitoring
Overview
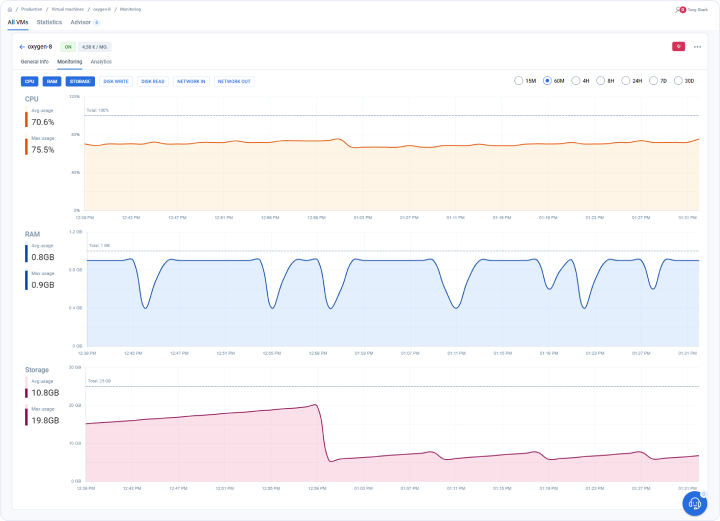
This page provides charts displaying trends over time regarding the average and maximum usage of:
- CPU
- RAM
- Storage
- Network “in” and “out” speeds in bps or Kbps
- Disk “read” and “write” speeds in bps or Kbps
Virtual machines with GPUs also display GPU monitoring indicators:
- GPU Utilization (% over a period).
- vRAM Usage (GB).
- vRAM Utilization (% over a period).
Users can select the time period as well for different views and time-dependent resource trends. For example - 15M = 15 minutes, 4H = 4 hours and 7D = 7 days.
Analytics on this page
How can I monitor my VMs in emma? - FAQ
This page provides charts displaying trends over time regarding the average and maximum usage of the following resources:
- CPU: The CPU chart displays the average and maximum usage of CPU resources over time, enabling users to monitor their usage patterns and identify any potential performance issues. For example, if the CPU usage spikes above normal levels, it could indicate a problem with a specific application or workload.
- RAM: The RAM chart shows the average and maximum usage of memory resources over time. Users can monitor their usage patterns and identify any potential performance issues. If RAM usage spikes above normal levels, it could indicate that there is a memory leak in a specific application or workload.
- Storage: The storage chart displays the average and maximum usage of disk space over time. Users can monitor their storage usage patterns and identify any potential storage capacity issues. For example, if the storage usage reaches maximum capacity, it could lead to slow application performance or even data loss.
- Network “in” and “out” speeds in bps or Kbps: The network chart displays the average and maximum network speeds for both inbound and outbound traffic over time. Users can monitor their network usage patterns and identify any potential network performance issues. For example, if the network speed drops below normal levels, it could indicate that there is congestion on the network or a problem with a specific application.
- Disk “read” and “write” speeds in bps or Kbps: The disk chart shows the average and maximum disk read and write speeds over time. Users can monitor their disk usage patterns and identify any potential performance issues. For example, if the disk read or write speeds are consistently slow, it could indicate a problem with the storage infrastructure or a specific application.
For virtual machines with GPUs, this page also provides charts for the following GPU-related metrics:
- GPU Utilization (% over a period): The GPU utilization chart displays the average and maximum percentage of time, during a given sampling interval, when the GPU was actively executing at least one compute or graphics workload. This metric indicates activity, not intensity, and helps users monitor GPU workload patterns over time.
- vRAM Usage (GB): The vRAM usage chart shows the average and maximum amount of video memory allocated and used by applications on the GPU over time. Users can monitor memory consumption patterns and identify workloads that may require more GPU memory resources.
- vRAM Utilization (% over a period): The vRAM utilization chart displays the average and maximum percentage of time during which the GPU’s video memory subsystem was actively servicing memory read or write operations. This helps users understand GPU memory activity and identify potential memory bandwidth bottlenecks.
In addition, users can select the time period for different views and time-dependent resource trends. For example, selecting 15M will display resource trends for the past 15 minutes, while selecting 7D will display resource trends for the past 7 days. This feature allows users to analyze resource usage patterns and identify any potential issues over different time periods.
GPU monitoring setup for virtual machines without preinstalled drivers
For GPU-enabled virtual machines created with operating systems that do not include preinstalled GPU drivers, additional setup is required to enable GPU monitoring. First, install the appropriate NVIDIA drivers for the virtual machine. After that, deploy the NVIDIA DCGM Exporter by following the official documentation available at NVIDIA DCGM Exporter. Once both the drivers and DCGM Exporter are properly installed and running, GPU utilization and memory metrics will begin to appear on the Monitoring tab.
Watch the video about VM monitoring
Last updated on 1 Aug 2026